
Historical study: This page documents conditions from January 1, 2020 through December 31, 2025. It does not state current prices, make a forecast, or provide individualized investment, legal, tax, or appraisal advice. Verify current product terms, prices, and local rules before a transaction.
Quick Answer
Between January 1, 2020 and December 31, 2025, precious-metals trading passed through a pandemic shutdown, a retail bullion shortage, an inflation shock, the fastest United States interest-rate tightening cycle in decades, war and sanctions, record central-bank gold purchases, persistent silver deficits, and a sharp reversal in the relative fortunes of platinum and palladium. The period was not one continuous "metals boom." It was a sequence of different markets in which the reason for buying, the form of ownership, the available inventory, and the route back to cash mattered as much as the benchmark price.
Gold and silver ended the six-year period with annual-average prices almost twice their 2020 levels. Platinum's annual average rose more moderately. Palladium, despite commanding the highest average price of the four metals from 2020 through 2022, finished 2025 at an annual average roughly half its 2020 level. Those figures describe wholesale reference prices. A person buying a one-ounce coin in a shortage paid the benchmark plus fabrication, distribution, financing, and dealer margin. A person selling the same coin usually received a dealer bid rather than the benchmark itself. As a result, two customers who chose the same metal at the same time could experience materially different outcomes depending on product, premium, custody, taxes, and resale channel.
The period's most durable lesson is that "the price of gold" or "the price of silver" is never the entire transaction. Buying and selling precious metals is a chain of contracts and services: the benchmark, the product, the seller's markup, payment and delivery, authentication, storage, insurance, and the eventual repurchase bid. The years 2020-2025 made that chain unusually visible because several links failed, tightened, or became expensive at the same time.
Key findings
- The pandemic created a temporary two-price market: wholesale reference prices continued to trade while small bars and coins became scarce, slow to replenish, and expensive relative to spot.
- Gold's demand leadership changed repeatedly. Exchange-traded funds dominated investment flows in 2020 and again in 2025; bar-and-coin demand led the 2021 rebound; central banks became a defining force from 2022 onward.
- Silver combined monetary demand with industrial demand. Physical investment surged in 2021 and 2022, while photovoltaic, electronics, automotive, and electrical uses helped produce five consecutive annual market deficits through 2025.
- Platinum moved from a severe 2020 deficit into surplus in 2021-2022 and back into deficits from 2023. Palladium moved the opposite way in price, falling as auto demand weakened, substitution increased, inventories were released, and the long-run shift toward battery-electric vehicles changed expectations.
- Retail premiums are not the same thing as metal appreciation. A high premium can disappear when supply normalizes, leaving a buyer exposed to both a lower benchmark and a lower product premium.
- The period also produced major enforcement actions against dealers accused of disguising extreme markups as scarcity or numismatic value. A disclosed two-way quote is a basic consumer-protection tool, not a minor convenience.
Scope, Definitions, and Method
This paper covers transactions and market developments from January 1, 2020 through December 31, 2025. Reports published in 2026 are used only when they provide final data for calendar year 2025. Forecasts for 2026 and later are excluded from the historical conclusions. Prices are stated in nominal United States dollars per troy ounce unless otherwise noted. Annual averages are used for cross-year comparisons because they are less vulnerable than a single year-end or intraday quotation to arbitrary timing.
"Buying" includes physical coins and bars, allocated and unallocated bullion accounts, physically backed exchange-traded products, futures and options, jewelry bought substantially for metal value, and scrap purchased for refining. "Selling" includes dealer repurchases, refinery and scrap transactions, exchange sales, redemptions, liquidation of vault interests, and the sale of metal-bearing products. These forms are not legally or economically interchangeable. A coin is personal property in the buyer's possession. An allocated account ordinarily identifies specific metal held for the owner. An unallocated account is generally a contractual claim against an institution. An exchange-traded fund share is a security whose holder usually cannot demand a small retail bar. A futures contract is a standardized derivative with margin and delivery rules.
The paper prioritizes primary or industry-standard sources: the London Bullion Market Association for benchmark-price summaries and Good Delivery rules; the World Gold Council for gold supply-and-demand data; the Silver Institute and Metals Focus for silver; the World Platinum Investment Council and Johnson Matthey for platinum-group metals; the Federal Reserve and Bureau of Labor Statistics for United States rates and inflation; the United States Mint for bullion distribution; and the Commodity Futures Trading Commission and FINRA for consumer protection. These organizations have different institutional interests, methodologies, and revision policies. Their figures should be read as carefully defined datasets, not as perfectly interchangeable measurements.
This is a market history, not a recommendation to buy or sell any metal or product. The period is unusually useful precisely because it frustrates simple rules. Gold sometimes rose with inflation and sometimes did not. Silver sometimes behaved like a monetary metal and sometimes like an industrial input. High rates pressured non-yielding assets, yet gold later reached records while policy remained restrictive. Palladium's scarcity did not protect a buyer who entered near the peak. The evidence supports transaction discipline more strongly than any universal price forecast.
The Six-Year Price Record
The annual-average figures below summarize the benchmark backdrop. They do not show the retail ask, dealer bid, taxes, shipping, storage, fund expense ratio, futures roll cost, currency conversion, or financing cost that an individual buyer may have faced. Still, they reveal the scale and direction of the period's revaluation.
| Year | Gold | Silver | Platinum | Palladium |
|---|---|---|---|---|
| 2020 | $1,769.59 | $20.55 | $882.63 | $2,192.54 |
| 2021 | $1,798.60 | $25.14 | $1,090.20 | $2,398.30 |
| 2022 | $1,800.09 | $21.73 | $960.51 | $2,112.06 |
| 2023 | $1,940.54 | $23.35 | $964.98 | $1,337.39 |
| 2024 | $2,386.20 | $28.27 | $955.73 | $983.62 |
| 2025 | $3,431.54 | $40.03 | $1,274.73 | $1,150.29 |
| Change, 2020-2025 | +93.9% | +94.8% | +44.4% | -47.5% |
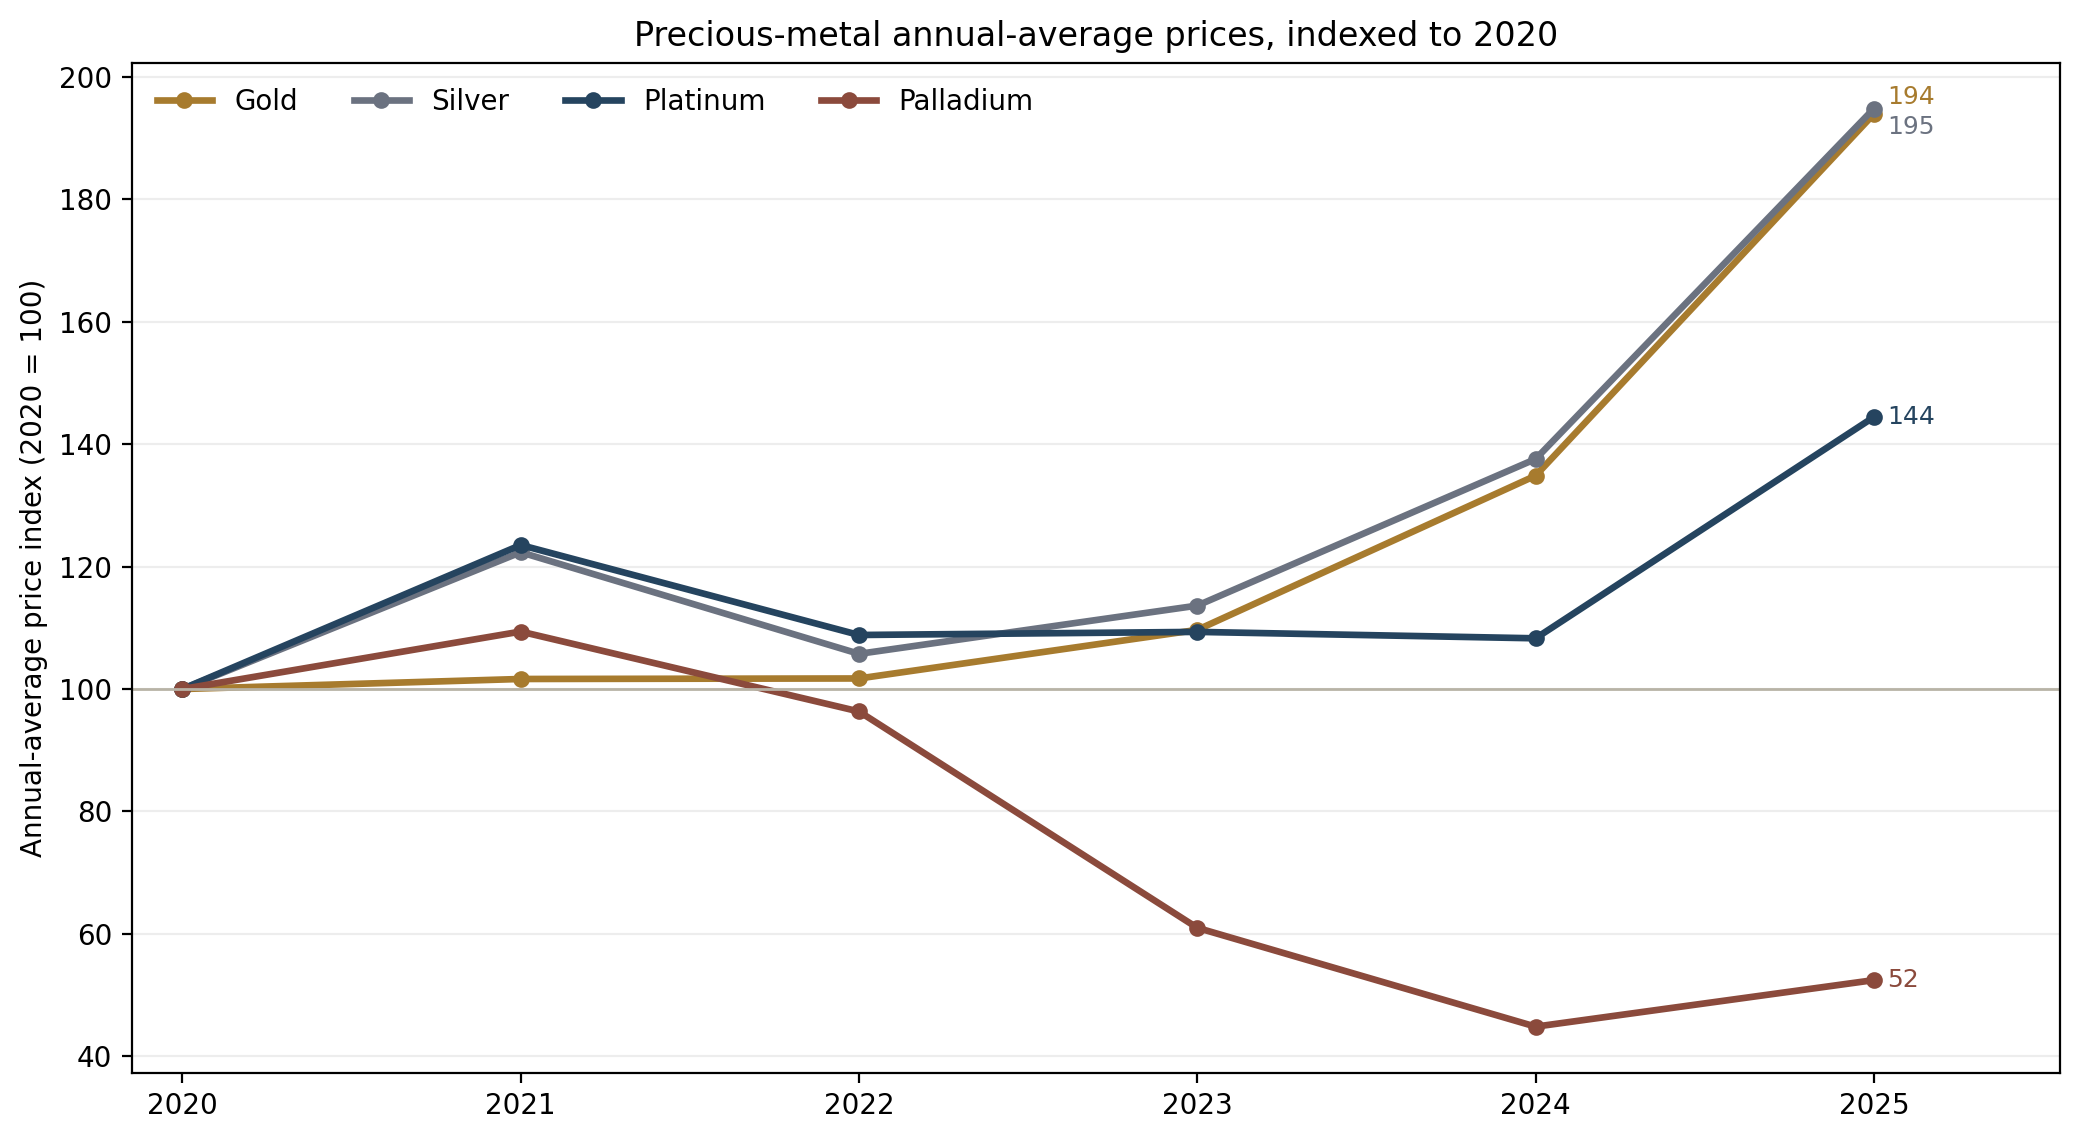
Sources: LBMA annual forecast-survey results reporting actual annual averages for 2020-2025 (LBMA 2021, 2022, 2023, 2024, 2025, 2026a). Rounded to two decimals; percentage changes calculated from the displayed averages.
The table resists a single story. Gold's annual average barely changed from 2020 to 2022 even though those years contained a record high, a sharp ETF reversal, an inflation surge, war, and historic central-bank demand. Silver's 2021 average was well above 2020, but it fell in 2022 even as total demand reached a record. Platinum's 2024 average was lower than its 2021 average, despite a market deficit. Palladium's average declined every year after 2021, even while supply risks periodically produced violent rallies. Annual supply-demand balance influences price, but so do inventories, expectations, interest rates, currency, substitution, and the urgency of marginal buyers and sellers.
A second caution is that a percentage change in an annual average is not an investor's realized return. A buyer entering at a daily high and selling at a later low may fare far worse. A buyer paying a 25 percent premium for a scarce retail coin has a different starting point from an institution buying a large bar near a wholesale benchmark. A seller who accepts the first mail-in offer may receive less than a seller who compares several live bids. Transaction history therefore belongs beside price history.
Four Prices in Every Physical Transaction
Benchmark or spot reference
Market commentary commonly uses "spot" as though it were a single cash-register price. In practice, benchmarks refer to defined wholesale markets, locations, settlement conventions, bar specifications, and times. The LBMA Gold Price and LBMA Silver Price are auction benchmarks. Loco London trading involves wholesale claims and Good Delivery metal under market conventions. Futures quotations refer to standardized contracts with particular delivery months and exchange rules. These prices are indispensable reference points, but a small buyer cannot normally purchase one retail coin simply by transmitting the benchmark amount (LBMA 2026b; CME Group 2026).
The benchmark answers a narrow question: at what level is standardized metal or exposure being valued in the relevant professional market? It does not answer whether a particular bar is genuine, whether the dealer has it in stock, whether credit-card payment will be accepted, how quickly it can be delivered, or what the dealer will pay to buy it back. Confusing those questions is one reason retail customers interpret every premium as profiteering or, in the opposite direction, accept any markup as proof of a shortage.
Retail ask
The retail ask is the amount the customer pays. It may include the benchmark value of the contained metal plus mint or refiner fabrication, wholesale distribution, dealer gross margin, hedging and financing, payment processing, insurance, shipping, compliance, inventory risk, and product-specific scarcity. The United States Mint explicitly states that its bullion coins are distributed through authorized purchasers rather than sold directly to the public, and that the Mint's price is based on the prevailing metal price plus a premium for minting, distribution, and marketing. Authorized purchasers and downstream dealers then create the retail market (United States Mint 2026a).
Premiums are dynamic. A common one-ounce sovereign coin may trade close to metal value when dealer inventories are ample, then command a much larger premium when mints ration output or retail demand overwhelms fabrication. A small fractional gold coin normally has a higher premium per ounce than a one-ounce coin because similar manufacturing and handling costs are spread across less metal. Silver products usually carry higher percentage premiums than gold because a low-value ounce still has to be minted, counted, packed, shipped, and verified.
Dealer bid
The dealer bid is what the dealer will pay. It reflects the benchmark, the probability that the item is genuine, assay or testing cost, local demand, inventory already on hand, the ease of reselling the exact product, and the dealer's need for margin. A widely recognized bullion coin in original condition may receive a stronger bid than an obscure commemorative round, a damaged product, or jewelry with uncertain fineness. Large bars may be efficient in professional channels but inconvenient in a local retail shop. A product can be "worth its metal" while still receiving a bid below theoretical melt value because somebody must verify, process, finance, and resell it.
A reliable dealer should be able to explain whether the bid is stated as a dollar amount, a percentage of spot, or a product-specific premium or discount. The buyer should ask for the repurchase policy before purchasing, not after. FINRA's consumer guidance similarly emphasizes asking about all fees, the spread between purchase and sale prices, storage, insurance, and how quickly the product can be liquidated (FINRA 2023).
Round-trip break-even
The economically relevant hurdle is often the round trip. If the retail ask is $2,200 and the immediate dealer bid is $2,050, the metal benchmark must rise enough to close a $150 gap before the buyer breaks even, assuming the premium and bid relationship remain unchanged. The simplest approximation is:
In the example, $2,200 divided by $2,050 minus one equals approximately 7.3 percent. This is not a forecast or a universal formula. The bid can move independently of the benchmark, premiums can contract, and taxes or storage can add further costs. The calculation is useful because it forces the customer to price the complete transaction rather than celebrate a small movement in spot while ignoring the original spread.
| Layer | What it measures | Why it can diverge |
|---|---|---|
| Benchmark | Standardized wholesale metal or market exposure | Location, contract, timing, bar standard, financing |
| Retail ask | What the buyer pays for the selected product | Fabrication, distribution, payment, inventory, dealer margin |
| Dealer bid | What a buyer of the product will pay the seller | Verification, resale demand, inventory, processing, risk |
| Net proceeds | Cash remaining after the sale | Shipping, assay, commissions, taxes, account or withdrawal fees |
2020: Pandemic Shock and the Two-Price Bullion Market
A financial panic became a logistics crisis
In March 2020, the pandemic struck both sides of the market. Investors sought liquidity and safe assets while refineries, mints, airlines, armored carriers, shops, and assay operations faced closures or restrictions. The Federal Reserve cut the federal-funds target range to 0-0.25 percent on March 15 and announced large purchases of Treasury and agency mortgage-backed securities. Eight days later it expanded support for market functioning without a preset quantity (Federal Reserve 2020a, 2020b). The macro response supported gold's monetary appeal, but the physical market had a more immediate problem: metal existed in the wrong forms and places.
A London Good Delivery bar, a COMEX-deliverable bar, and a one-ounce retail coin all contain valuable metal, yet they are not instantly interchangeable. Refining and fabrication capacity is required to convert one form into another. Passenger flights that normally carried high-value cargo were cancelled. Swiss refinery interruptions constrained a critical processing hub. Retail coin shops closed or shifted to appointment and mail order. Dealers faced one-way buying and difficulty replacing stock. The World Gold Council recorded refinery and mint closures, supply-chain constraints, and unusually high small-bar and coin premiums in Europe during the first half of 2020 (World Gold Council 2021a).
The result was popularly described as a disconnect between "paper" and "physical" prices. That phrase captured a real retail experience but often overstated the separation. Professional markets continued to clear; the problem was that the deliverable object in one market was not the same product desired in another. A one-ounce silver coin could command an exceptional retail premium even when wholesale silver was available in large bars, because minting capacity and dealer inventory were the binding constraints. The spread was a price for transformation, distribution, and immediacy.
Gold: record ETF inflows and a scramble for coins
Gold's 2020 annual average was $1,769.59, up substantially from 2019, and the LBMA price reached a then-record $2,067.15 on August 6. Yet demand composition was extraordinary. Total gold demand excluding over-the-counter activity fell 14 percent to 3,759.6 tonnes, an eleven-year low, as jewelry demand collapsed 34 percent to 1,411.6 tonnes. At the same time, gold-backed exchange-traded products added a record 877.1 tonnes. Bar-and-coin demand increased 3 percent to 896.1 tonnes, while official coin demand reached a record 297.6 tonnes and rose 33 percent (World Gold Council 2021b, 2021c).
Those statistics describe two distinct buying experiences. ETF investors could obtain price exposure through exchange trading without finding a coin, arranging insured delivery, or accepting a local dealer's wait list. Physical buyers wanted direct possession or a product outside the banking and brokerage system, but they encountered delayed fulfillment and elevated premiums. The ETF was liquid and scalable; the coin was tangible and independent. Neither was simply a superior version of the other. Each solved a different problem and carried a different chain of intermediaries.
Selling behavior was equally divided. Financial investors could liquidate ETF shares quickly during market hours. Households facing economic stress sold jewelry and scrap where buyers remained open, but lockdowns disrupted collection and refining. Existing bullion holders sometimes withheld metal because they expected higher prices or because dealers' retail shelves were already empty. A dealer might pay above the usual relationship to spot for immediately resalable coins while offering less attractive terms for unfamiliar jewelry requiring assay.
Silver: a crash, a historic ratio, and a retail rush
Silver initially behaved more like an industrial commodity in a sudden recession. Its price fell sharply in March, while gold held up better, pushing the gold-silver ratio above 127 - an extreme expression of silver's dual identity. Later, fiscal and monetary stimulus, recovering risk appetite, and physical investment reversed the move. The 2020 annual average silver price was $20.55, 27 percent above 2019, and the ratio ended the year near 72 (Silver Institute 2021).
Global silver demand fell 10 percent to 896.1 million ounces as industrial demand declined 5 percent to 486.8 million ounces. Mine production fell 5.9 percent to 784.4 million ounces. Yet physical investment rose 8 percent to 200.5 million ounces, and holdings in silver exchange-traded products increased by 331 million ounces to 1.067 billion ounces. Retail buyers were purchasing into a market where mints and dealers could not immediately expand small-product supply (Silver Institute 2021).
This distinction explains why buyers saw very high coin premiums at moments when the benchmark price looked depressed. Wholesale silver is bulky relative to its dollar value. Fabrication, freight, storage, and counting therefore consume a larger share of the retail price than they do for gold. A shortage of finished coins does not prove that the world has no silver; it proves that the available silver cannot reach the desired customer, in the desired form, at the usual cost and speed.
Platinum and palladium: collapsed auto production, constrained supply
Platinum-group metals entered the pandemic with heavy exposure to automotive and industrial demand. Vehicle shutdowns reduced autocatalyst consumption, but mine and recycling supply were also hit. The World Platinum Investment Council ultimately estimated a 2020 platinum deficit of about 932,000 ounces, with supply down 17 percent and demand down 7 percent. Investment demand and exchange stocks absorbed metal even as industrial activity weakened (WPIC 2021).
Palladium remained in significant deficit according to Johnson Matthey. Lower vehicle production was partly offset by higher loadings in gasoline autocatalysts, while supply disruption and existing tightness supported price (Johnson Matthey 2021a). Palladium's annual average of $2,192.54 was more than twice platinum's. For a retail customer, however, the high benchmark did not guarantee easy resale. The market for one-ounce palladium products was far thinner than the markets for common gold and silver coins. A strong global industrial price could coexist with limited local dealer appetite.
2020 therefore exposed the complete transaction stack. Monetary policy affected benchmark demand; mine and refinery restrictions affected supply; fabrication bottlenecks affected product availability; transportation affected delivery; dealer balance sheets affected bids; and fear affected willingness to hold inventory. The year's most famous bullion premiums were not a separate market truth replacing spot. They were the retail price of a disrupted chain.
2021: Reopening, Retail Momentum, and the Return of Product Supply
The benchmark stabilized while physical investment accelerated
Gold's annual average edged up to $1,798.60 in 2021, but the year's flow data reversed the pattern of 2020. Global gold demand recovered to 4,021 tonnes. Gold-backed ETFs experienced net outflows of 173 tonnes after the prior year's record inflow. Bar-and-coin investment rose 31 percent to 1,180 tonnes, an eight-year high. Central-bank buying increased 82 percent to 463 tonnes, and jewelry demand recovered as economies reopened (World Gold Council 2022).
For sellers, 2021 brought a more normal supply chain but not a complete return to pre-pandemic conditions. Mints expanded output, dealers rebuilt stock, and two-way markets improved. Some premiums remained elevated because demand stayed strong and specific products were still rationed. The critical shift was that customers again had choices. They could compare multiple coins, bars, delivery windows, and bids rather than accept whichever item happened to be available.
This normalization punished anyone who had mistaken a temporary product premium for permanent numismatic value. A buyer who paid an exceptional markup in 2020 could watch the benchmark hold steady while the premium contracted. The coin did not become counterfeit or worthless; its scarcity component simply faded. The episode demonstrates why a purchase invoice should separate metal value from product premium and why buyers should compare the seller's current ask with its current repurchase bid.
Silver's retail surge and the social-media moment
Silver became a focal point for online retail campaigns in early 2021. Some participants bought coins and bars, some traded futures or options, and some bought shares of exchange-traded products. These were different actions with different mechanisms. The CFTC later reported that retail participation in silver futures during February 2021 reached roughly three times the average participation observed in its January 2020-February 2021 study window. The agency also noted that many retail participants were short-term traders rather than long-term holders (CFTC 2021).
The physical market nevertheless recorded a genuine demand surge. Total silver demand rose 19 percent to 1.05 billion ounces. Physical investment jumped 36 percent to 278.7 million ounces. Industrial demand increased 9 percent to 508.2 million ounces, photovoltaic demand rose 13 percent to 113.7 million ounces, and the market registered a 51.8-million-ounce deficit. Exchange-traded product holdings added 65 million ounces and ended near 1.13 billion ounces (Silver Institute 2022).
A retail campaign can therefore affect several layers at once without "breaking" the wholesale market. Coin inventories can vanish quickly because finished-product capacity is small relative to total above-ground silver. Futures prices can respond to orders, hedging, and expectations. ETF creation can require professional-market metal depending on fund structure. Yet a household buying ten coins does not automatically force immediate delivery of ten ounces from a mine. The chain includes wholesalers, authorized participants, fabricators, vaults, and inventories accumulated in earlier periods.
Platinum recovery and palladium's peak average
Platinum's annual average rose to $1,090.20, the highest of the six-year period until 2025. The market moved from the severe 2020 deficit toward an estimated 2021 surplus of roughly 769,000 ounces as supply recovered. Even so, exchange-stock outflows and unusually strong imports into China created episodes of physical tightness that were not obvious from the annual surplus alone (WPIC 2022a).
Palladium averaged $2,398.30, the highest annual average among all four metals during the six years. Johnson Matthey expected strong gasoline autocatalyst demand and a deficit exceeding 800,000 ounces as vehicle production and industrial activity recovered. Semiconductor shortages limited auto output, however, and the market began to confront substitution: automakers had an incentive to replace expensive palladium with platinum where engineering and emissions rules allowed (Johnson Matthey 2021b).
For buyers, 2021 illustrated the danger of extrapolating scarcity. Palladium had a compelling deficit narrative and high industrial value, but its demand was concentrated. A metal whose marginal use depends heavily on one technology can reprice violently when manufacturers thrift, substitute, draw down inventory, or revise future production plans. Retail spreads added a second risk because fewer shops handled palladium than gold or silver.
2022: Inflation, War, Sanctions, and a New Gold Buyer
Inflation rose, then interest rates rose faster
United States consumer-price inflation reached 7.0 percent from December 2020 to December 2021 and 6.5 percent from December 2021 to December 2022, compared with 1.4 percent during 2020. The Federal Reserve began raising its target range in March 2022, moving from 0-0.25 percent to 0.25-0.50 percent, and continued with rapid increases through the year (BLS 2025; Federal Reserve 2022a).
The sequence complicated the popular claim that metals rise whenever inflation rises. Inflation can increase demand for assets perceived as stores of value, but tighter monetary policy raises the opportunity cost of holding a non-yielding metal and can strengthen the dollar. Gold's annual average was $1,800.09 - almost unchanged from 2021 - despite extraordinary inflation and geopolitical stress. Silver's average fell to $21.73. The transaction lesson is that a correct observation about inflation does not determine the timing or profitability of a specific purchase.
Retail customers also faced higher financing costs. Dealers carrying inventory paid more for capital as rates rose. Leveraged metal accounts became more dangerous because adverse moves could trigger margin calls. A purchaser borrowing against retirement assets or using a dealer-arranged financing scheme was exposed not only to the metal price but also to interest, storage, commissions, and liquidation terms. The CFTC has repeatedly warned that such arrangements may leave little of the customer's deposit invested in actual metal (CFTC 2026a).
Russia's invasion changed acceptable metal, not merely price
Russia's invasion of Ukraine in February 2022 created immediate concern about the supply of gold and platinum-group metals. The market response was institutional as well as financial. On March 7, the LBMA suspended six Russian gold and silver refiners from its Good Delivery lists. Bars produced while those refiners were listed remained Good Delivery, but bars produced after suspension were no longer accepted as new Good Delivery material in the London market. Later sanctions restricted newly produced Russian gold in several jurisdictions (LBMA 2022a, 2023a).
This distinction mattered to sellers. Two chemically similar bars could have different marketability because of production date, refiner status, sanctions, custody history, and location. Provenance became a component of price and settlement. A buyer concerned only with fineness could overlook that a future institutional buyer might reject or discount metal that was legally restricted or outside an accepted chain of custody.
The episode also showed why responsible-sourcing and sanctions controls are not abstract corporate policies. Dealers, refiners, vaults, banks, and funds need to know who produced metal, when it entered the market, and whether it can legally move across borders. LBMA's Responsible Gold Guidance Version 9, effective from January 2022, expanded expectations concerning recycled gold, origin, ESG risks, disclosure, and auditor independence (LBMA 2021a).
Gold: central banks transformed the demand story
Global gold demand rose 18 percent to 4,741 tonnes in 2022, the highest annual total in more than a decade under the World Gold Council's then-current series. Bar-and-coin demand reached 1,217 tonnes. Gold ETFs lost 110 tonnes, but central banks and other official institutions purchased an estimated 1,136 tonnes - a record in the Council's dataset at the time and a dramatic increase over 2021 (World Gold Council 2023).
The identity of the marginal buyer matters. ETF flows can reverse rapidly through securities markets. Households buying small bars respond to local currency, inflation, cultural demand, taxes, and product premiums. Central banks operate for reserve diversification, liquidity, geopolitical, and policy reasons. Their purchases are not a guarantee of rising prices, but sustained official-sector demand changed the balance of the market and became a central explanation for gold's resilience during high real rates.
For retail sellers, elevated official demand did not mean a central bank would purchase a necklace or collectible coin. The metal had to travel through dealers, scrap collectors, refiners, and professional bars before it could enter institutional channels. A household's price still depended on purity, testing, and local competition. The global demand story supported the benchmark; the local sale required a functioning conversion route.
Silver: record demand, a record deficit, and mixed prices
Total silver demand reached a record 1.242 billion ounces in 2022. Industrial demand rose to 556.5 million ounces. Physical investment increased about 22 percent to approximately 337.6 million ounces, while jewelry fabrication reached 234.1 million ounces. Mine production was roughly flat at 822.4 million ounces, and the market recorded a 237.7-million-ounce deficit, the largest in the modern Silver Institute series at that time (Silver Institute 2023).
Yet silver's annual-average price declined from 2021. The apparent contradiction is instructive. A market deficit is not the same as an immediate physical exhaustion. Above-ground inventories can bridge a shortfall. Investors can sell exchange-traded holdings. Industrial users can thrift. Prices incorporate expectations before final annual statistics are published. A demand record can coexist with a lower annual average when macroeconomic liquidation, dollar strength, high rates, and inventory flows dominate the marginal trade.
Retail buyers in 2022 often encountered another divergence: strong coin-and-bar demand maintained premiums even while benchmark silver weakened. A buyer averaging down in spot could still pay a stubbornly high delivered price. Conversely, a seller holding a popular coin might receive a product premium above spot from a dealer needing inventory. The correct comparison was not spot versus last year's spot, but today's full ask versus today's executable bid.
Palladium's war spike and platinum's substitution case
Russia was a major source of palladium, so invasion-related supply fears drove extreme volatility. Palladium's annual average remained high at $2,112.06, but the year also accelerated forces that would later push it lower. Vehicle production stayed constrained, manufacturers continued thrift and substitution, and the long-term growth of battery-electric vehicles weakened expectations for gasoline autocatalyst demand.
Johnson Matthey assessed palladium and rhodium as returning to deficit in 2022 as South African supply declined and Russian risk intensified. At the same time, platinum substitution in gasoline catalysts became more important because palladium was expensive relative to platinum (Johnson Matthey 2022). Platinum's annual average fell to $960.51, and the WPIC estimated a 2022 surplus of about 447,000 ounces, but the relative price gap supported future substitution.
A retail buyer following the geopolitical headline could have bought palladium near a temporary scarcity premium. The industrial purchaser had more options: redesign, thrift, inventory drawdown, long-term supply contracts, or substitution. The household holder could only wait or sell into a thin market. This asymmetry is one reason industrial scarcity stories require more caution in retail portfolios than in procurement analysis.
2023: High Rates, Gold Resilience, and a Split Retail Market
The cost of holding metal changed
By July 2023, the Federal Reserve had raised the federal-funds target range to 5.25-5.50 percent. It then held that range for the rest of the year and into 2024. United States CPI inflation slowed from 6.5 percent in 2022 to 3.4 percent from December 2022 to December 2023, but short-term cash and government securities offered yields that bullion could not (Federal Reserve 2023; BLS 2025).
This environment should have been hostile to gold under a simple opportunity-cost model. Gold does not pay interest, so a higher risk-free yield makes holding it more expensive relative to cash. Yet the annual average gold price rose 7.8 percent to $1,940.54, and the year-end price reached $2,078.40, producing a roughly 15 percent annual return on the benchmark measure used by the World Gold Council. The outcome reflected more than inflation: central-bank demand, geopolitical risk, currency expectations, and a late-year reassessment of future rates all mattered (World Gold Council 2024).
The divergence between price and investment vehicle was striking. Gold-backed ETFs lost 244 tonnes, while central banks purchased 1,037 tonnes. Bar-and-coin demand slipped only 3 percent. Total demand excluding over-the-counter flows was 4,448 tonnes; including the Council's estimate of OTC and other demand, it reached a record 4,899 tonnes (World Gold Council 2024). A seller watching only ETF outflows could reasonably expect weakness and still be wrong because other buyers absorbed metal.
Retail normalization produced winners and losers
The physical market was more orderly than during the pandemic years. Common bullion became easier to source, delivery times improved, and premiums on some products narrowed. That was good for new buyers but disappointing for owners who had paid exceptional markups. The benchmark could rise while the resale premium on a particular coin declined, reducing the holder's net gain.
The year also widened the split between retail gold and silver. Gold's rising benchmark encouraged scrap flows: recycled gold increased 9 percent to 1,237 tonnes. Silver physical investment, by contrast, fell almost one-third to 243.1 million ounces after the 2022 record. German demand collapsed after a change in value-added-tax treatment, and Indian investment also fell sharply. A global narrative about inflation or de-dollarization could not overcome local tax rules, inventory overhang, and the fact that many buyers had already accumulated metal in 2021-2022 (Silver Institute 2024).
This is why "retail demand" must be located. An American coin dealer, an Indian bar buyer, a German tax-sensitive investor, and a Chinese jewelry customer did not inhabit the same market. National currency, taxes, cultural forms, product availability, and local resale networks changed both the price paid and the willingness to sell.
Silver industrial demand became the stronger structural argument
Silver's annual average rose to $23.35 in 2023. Industrial demand increased 11 percent to a new record, supported by photovoltaic manufacturing, electronics, electrical infrastructure, and automotive uses. Mine production declined about 1 percent to 830.5 million ounces, while recycling was 178.6 million ounces. The market remained in deficit even as physical investment fell (Silver Institute 2024).
The implication was not that retail investment no longer mattered. It was that silver's demand base was changing. A coin buyer competes indirectly with industrial users, but the transmission is not immediate. Manufacturers often purchase through contracts and fabricators, hold working inventories, and reduce silver use per unit when prices rise. Photovoltaic producers can increase total silver demand by manufacturing more cells while simultaneously reducing the silver content of each cell. The physical investor sees the aggregate result only after these adjustments.
For sellers of scrap, stronger industrial demand supported refinery economics, but purity remained decisive. Sterling flatware, jewelry, electronics, and photographic waste have different recovery rates and processing costs. The headline silver price did not tell a household what a specific item was worth. The sale required a fineness estimate, recoverable weight, and a refiner or buyer willing to process that category.
Palladium fell as platinum's substitution story matured
Palladium's annual average collapsed to $1,337.39 from $2,112.06 in 2022. Johnson Matthey described the market as moving closer to balance: supply increased modestly, automotive demand recorded a fourth consecutive annual decline and remained around 15 percent below 2019, and platinum substitution reduced palladium use in gasoline catalysts (Johnson Matthey 2023).
Platinum averaged $964.98 - almost unchanged from 2022 - despite an estimated market deficit of about 896,000 ounces. The deficit was absorbed partly through above-ground stocks. This contrast is essential. Palladium's benchmark fell dramatically even though the metal was still indispensable in many vehicles; platinum's benchmark remained subdued even though current demand exceeded current supply. Price responds to the quantity available for sale now, expected future balances, substitution, and inventory holders' willingness to release metal, not only to a single year's mine-versus-demand arithmetic.
A retail seller of palladium confronted both falling spot and shrinking local appetite. Dealers who had watched inventories lose value became cautious, widening spreads or refusing unfamiliar products. A buyer of platinum could acquire metal at a much lower price than palladium, but also faced thin retail liquidity. The comparison rewarded the person who had investigated the exit before entering.
2024: Gold Breakout, Silver's Fourth Deficit, and Retail Cooling
Gold escaped the old trading range
Gold's annual average jumped 23 percent to $2,386.20 in 2024, and the LBMA price set forty record highs. Total demand including OTC flows reached a record 4,974 tonnes. Investment demand rose 25 percent to 1,180 tonnes, while bar-and-coin demand held near 1,186 tonnes. Central banks purchased more than 1,000 tonnes for the third consecutive year. Jewelry consumption volumes fell under the pressure of higher prices, but the value of jewelry demand remained large (World Gold Council 2025).
The breakout occurred while United States policy rates remained at 5.25-5.50 percent through the summer. The Federal Reserve began easing on September 18 with a half-percentage-point reduction to 4.75-5.00 percent and ended the year at 4.25-4.50 percent (Federal Reserve 2024a, 2024b). Gold had therefore begun its move before rates fell. Markets were pricing a combination of eventual easing, sustained official buying, geopolitical risk, fiscal concerns, and momentum.
For buyers, the speed of the rise changed product economics. A dealer holding inventory could see the dollar value of each ounce increase faster than replacement lines or customer credit limits. In a rising market, displayed website inventory and checkout prices may lag or be withdrawn while the dealer re-hedges. Payment method matters because a card charge can be reversed while a metal price cannot; dealers often price bank-wire, cash, check, and card orders differently.
For sellers, record prices encouraged jewelry and scrap liquidation, but recycling rose less dramatically than many analysts expected. Global recycled supply increased, yet many households did not sell because they viewed gold as savings, because local-currency prices had a different path, or because sentimental and jewelry values exceeded melt offers. The relationship between price and scrap supply is therefore elastic but not mechanical.
High price reduced volume without erasing demand
Jewelry demand demonstrates the difference between ounces and dollars. As the gold price rose, global jewelry consumption volume fell, but spending could remain high because each gram cost more. Retailers adapted with lighter products, lower-carat alloys, exchanges of old jewelry for new, and smaller ticket sizes. A report that "jewelry demand fell" may refer to metal tonnage, not revenue, transactions, or cultural interest.
This distinction also affects used-gold sellers. A shop may offer a high dollar amount compared with prior years while paying the same or a lower percentage of theoretical melt. The customer sees a record check; the dealer sees assay risk, refining delay, and a larger dollar exposure per item. Comparing offers as a percentage of recoverable metal value is more informative than comparing only the headline cash amount.
Silver set records in factories while coin demand declined
Silver's annual average rose to $28.27 in 2024. Industrial demand reached a record 680.5 million ounces, and total demand was about 1.16 billion ounces. The market posted a 148.9-million-ounce deficit, its fourth consecutive shortfall, bringing the cumulative 2021-2024 deficit to approximately 678 million ounces. Mine production fell to 819.7 million ounces, while recycling increased 6 percent to 193.9 million ounces (Silver Institute 2025).
Physical investment did not share the industrial boom. Coin and net bar demand fell 22 percent to 190.9 million ounces, including a 46 percent decline in the United States. The contrast illustrates inventory cycles. Many households had bought heavily during 2020-2022 and did not need to repeat those purchases. Higher prices encouraged some profit-taking. Premiums normalized as mint output became easier to obtain. Industrial users, meanwhile, were consuming silver through products whose buyers might never think of themselves as silver investors.
The market deficit was supplied by above-ground stocks. This is normal until it is not. Inventories exist precisely to bridge periods when current fabrication demand exceeds current mine and recycling supply. The important questions are where the inventories are, what form they take, whether holders will lend or sell them, and how much price is required to mobilize them. Those questions became acute in 2025.
Platinum and palladium moved through inventory, not only mines
Platinum's annual average was $955.73, slightly below 2023, even though the WPIC estimated a deficit near 992,000 ounces. Palladium averaged $983.62, the first annual average below $1,000 in the period. Johnson Matthey observed that users had accumulated excess PGM inventory during the disruptions of 2020-2022 and then drew down or sold those stocks in 2023-2024. That inventory release reduced the need for immediate primary purchases and helped shrink apparent tightness (Johnson Matthey 2024; WPIC 2025a).
The retail lesson was uncomfortable but useful: a deficit does not impose a deadline on the market. Above-ground holders can sell for years, and industrial users can change recipes. Platinum buyers who expected an immediate shortage-driven spike were forced to wait. Palladium buyers faced a falling benchmark and a structural debate over gasoline vehicles. Both metals retained real industrial scarcity, but neither gave the small holder control over timing.
2025: Revaluation, Renewed Investment, and Liquidity Stress
Gold moved from record to regime change
Gold's 2025 annual average reached $3,431.54, 44 percent above 2024 and 93.9 percent above 2020. The LBMA Gold Price set fifty-three new all-time highs. Total gold demand including OTC exceeded 5,000 tonnes for the first time, with an estimated value of $555 billion. Gold-backed ETF holdings increased 801 tonnes, the second-strongest year on record, while bar-and-coin demand reached a twelve-year high. Central-bank purchases remained historically elevated at 863 tonnes (World Gold Council 2026a; LBMA 2026a).
The composition matters. In 2020, ETF inflows had occurred while jewelry collapsed and central-bank buying slowed. In 2025, ETF inflows, bar-and-coin demand, and central-bank purchases were all substantial at the same time. The market no longer depended on one investment channel. That breadth increased pressure on available metal and raised the dollar cost of carrying inventory throughout the chain.
Mine production increased only slightly to a record 3,671.6 tonnes, and recycled gold rose 3 percent to 1,404.3 tonnes. The recycled response was muted relative to the price increase. Jewelry fabrication volume fell 19 percent to 1,638 tonnes, but investment demand rose 84 percent to 2,175.3 tonnes under the World Gold Council's classification (World Gold Council 2026a). Gold was being redirected from adornment and existing holdings toward investment, but not rapidly enough to prevent record prices.
The buyer's problem shifted from shortage of specific coins to affordability. At $3,000-$4,000 per ounce, a one-ounce purchase required far more cash than in 2020. Fractional products lowered the ticket price but increased the premium per ounce. Some buyers moved to silver; others used ETFs or vaulted fractional interests. Each substitution changed the legal rights and cost structure. A lower cash entry was not necessarily a lower percentage cost.
The seller's problem was execution risk in a fast market. An offer quoted as "spot minus 2 percent" could change by hundreds of dollars per ounce before a shipment arrived. Mail-in sellers needed to know when the price was locked: at order creation, package receipt, assay completion, or customer acceptance. Dealers needed clear cancellation and market-loss policies. Record prices made vague terms more expensive.
Silver's annual average surged and the market briefly seized
Silver's annual average rose 42 percent to $40.03 in 2025, almost 95 percent above 2020. The LBMA series began the year near $29.41 and reached $74.84 on December 30, producing enormous variation between buyers depending on timing. The gold-silver ratio also moved through a wide range as the two metals made records at different times (LBMA 2026a).
The Silver Institute's final 2025 review described an unprecedented liquidity squeeze in October. Falling inventories, movement of metal into CME vaults, higher exchange-traded-product holdings, and a surge in bar-and-coin demand tightened regional availability and drove lease rates and prices sharply higher. Global demand exceeded supply for a fifth consecutive year (Silver Institute 2026).
Total silver demand declined 2 percent to 1.13 billion ounces, and industrial demand fell 3 percent to 657.4 million ounces after four years of growth. Those declines did not prevent a squeeze because liquidity depends on available inventory at a particular place and time, not only on annual global demand. Coin and net bar demand increased 14 percent. Mine production rose 3 percent to 846.6 million ounces, and recycling reached a twelve-year high of 197.6 million ounces, with jewelry and silverware selling contributing to supply (Silver Institute 2026).
This is a crucial distinction between balance and liquidity. A market can have a smaller annual deficit than the previous year and still experience a violent short-term shortage of lendable or deliverable metal. The same principle seen in retail coins during 2020 appeared at a larger market level in 2025: form, location, ownership, and willingness to lend mattered.
Retail buyers again faced the risk of purchasing both a high benchmark and an emergency premium. A coin bought during a squeeze might require a large subsequent rise merely to overcome the spread if wholesale conditions normalized. Sellers with immediately deliverable, recognizable products could receive unusually strong bids, but scrap or obscure items still required processing. The shortage rewarded market-ready metal more than metal in the abstract.
Platinum and palladium reversed direction
Platinum's annual average rose to $1,274.73, 33 percent above 2024 and 44 percent above 2020. LBMA data show an extraordinary 2025 range, from roughly $920 to $2,226, with the metal ending near the high. Palladium averaged $1,150.29, recovering from 2024 but remaining 47.5 percent below 2020 (LBMA 2026a).
Final 2025 assessments published in 2026 concluded that all major platinum-group metals were in deficit. The WPIC estimated a platinum shortfall of about 1.082 million ounces, the third consecutive annual deficit. Johnson Matthey reported strong PGM prices supporting a recovery in autocatalyst recycling and confirmed that palladium had remained in persistent deficit through 2025 even as long-term automotive demand expectations weakened (WPIC 2026; Johnson Matthey 2026).
For platinum, several years of deficits finally coincided with strong investment and jewelry interest, constrained mine supply, and reduced above-ground availability. For palladium, higher prices helped mobilize scrap but did not restore the 2021 valuation. A metal can recover sharply from a depressed level without invalidating the structural forces that caused the decline.
Retail liquidity remained the limiting factor. A buyer could see platinum double from a low yet receive a materially weaker local bid than a gold owner because the dealer's customer base was smaller. Palladium sellers needed especially careful product and counterparty selection. The global benchmark had recovered; the local two-way market had not necessarily deepened.
Rates eased, but the old relationship did not return
The Federal Reserve ended 2025 with a target range of 3.50-3.75 percent after reductions during 2024 and 2025. United States CPI inflation was 2.7 percent from December 2024 to December 2025, far below its 2021-2022 peak but still above the Federal Reserve's longer-run objective (Federal Reserve 2025; BLS 2026).
Gold and silver therefore reached record annual averages in a year of lower, but not zero, policy rates and moderating, but not vanished, inflation. The six-year record does not support a one-variable model. Rates affected currency, financing, and opportunity cost. Inflation affected confidence and purchasing power. Central banks, ETFs, physical buyers, industrial users, sanctions, and inventories changed the marginal trade. The buyer who waited for a textbook macro signal often discovered that the market had already repriced.
The Gold Market Across 2020-2025
Gold was the period's most diversified market. Its buyers included households, jewelers, central banks, ETFs, futures traders, wealth managers, technology manufacturers, and institutions holding large bars. Demand leadership rotated: record ETF additions in 2020, an eight-year high in bar-and-coin demand in 2021, record central-bank buying in 2022, continued official-sector strength in 2023-2024, and simultaneous ETF, bar-and-coin, and central-bank demand in 2025.
| Year | Dominant gold-market feature | Practical effect on buyers and sellers |
|---|---|---|
| 2020 | Record ETF inflows; retail fabrication bottlenecks | Fast financial access, scarce small products, high premiums |
| 2021 | Bar-and-coin rebound; ETF outflows | Better physical supply, premium normalization, strong retail demand |
| 2022 | Record central-bank buying; war and sanctions | Benchmark resilience, greater provenance scrutiny |
| 2023 | High rates but continued official demand | Gold rose despite ETF outflows; channels diverged |
| 2024 | Price breakout and forty records | Affordability pressure; more scrap offers; inventory risk |
| 2025 | Broad investment surge and fifty-three records | Larger dollar spreads, fractional demand, execution risk |
Gold's resale advantage was not merely price performance. It possessed the broadest network of recognizable products, professional vaults, refineries, banks, jewelers, and dealers. That network usually produced tighter percentage spreads than silver or PGMs for standard products. A common sovereign one-ounce coin could be tested and resold quickly in many countries. A generic or damaged product still had metal value, but the route to that value was less direct.
The period also showed gold's limits. It was not immune to drawdowns, it generated no yield, and product premiums could contract. Jewelry sellers rarely received the original retail workmanship or brand markup from a scrap buyer. ETF investors held securities rather than coins. Unallocated account holders relied on counterparties. The metal's broad market reduced friction; it did not remove legal and operational distinctions.
The Silver Market Across 2020-2025
Silver offered the period's clearest example of dual demand. Investment flows reacted to fear, inflation, price momentum, and online campaigns. Industrial demand reacted to photovoltaic output, electronics, vehicles, grids, brazing, and chemical catalysts. These forces could reinforce one another, as in parts of 2025, or move in opposite directions, as in 2023-2024 when industrial demand set records while physical investment fell.
Silver's bulk made retail mechanics unusually important. At $20-$40 per ounce, a meaningful dollar purchase required many coins or bars. Shipping, storage, insurance, and counting remained substantial. A one-ounce coin's fabrication cost represented a large percentage of metal value. The market therefore repeatedly displayed high retail premiums without requiring a global absence of wholesale silver.
Five consecutive deficits from 2021 through 2025 reduced above-ground availability, but the timing of stress depended on inventory location and ownership. Industrial users could draw stocks, exchange-traded products could gain or lose metal, and regional inventories could shift toward futures delivery. The October 2025 squeeze demonstrated that a market can appear adequately supplied in annual totals until several inventory channels tighten together.
For sellers, silver's low unit value created a threshold problem. A dealer may offer a competitive percentage on large, recognizable bars but less on mixed flatware, plated objects, or small lots because testing and shipping consume value. Hallmarks matter, but "silver color" does not. Sterling, coin silver, 800-fineness material, plated goods, and weighted candlesticks have very different recoverable content.
Platinum and Palladium Across 2020-2025
Platinum and palladium were shaped more heavily by industrial concentration and supply geography than gold. Automotive catalysts represented a major use, South African and Russian production mattered disproportionately, and recycling depended on the collection of end-of-life vehicles. Pandemic shutdowns could reduce both mine supply and vehicle demand. Semiconductor shortages could suppress vehicle output. High prices could encourage thrift, substitution, and recycling.
Platinum's six-year path was a delayed-tightness story. It recorded a severe deficit in 2020, surpluses in 2021-2022 as supply and inventories adjusted, and deficits again from 2023 through 2025. Its annual-average price, however, remained near $960 for 2022-2024 before rising sharply in 2025. The lag showed how above-ground stocks can postpone price adjustment.
Palladium's path was a peak-and-reversal story. It averaged above $2,000 from 2020 through 2022, supported by emissions-control demand, constrained supply, and geopolitical risk. It then fell as automakers substituted platinum, vehicle demand stayed below earlier expectations, inventories returned to market, and battery-electric adoption weakened long-term demand projections. The 2025 rebound did not restore the earlier peak.
The retail markets for both metals were thinner. Fewer mints produced them, fewer dealers advertised firm repurchase bids, and local awareness was lower. A buyer might pay a high percentage premium for a rare retail format and later find that rarity did not translate into a strong bid. For industrial metals, "rare" and "liquid" are almost opposite questions.
How People Bought Precious Metals During the Period
Coins and small bars
Coins and small bars were the period's most visible products because they sat at the point where global prices met household logistics. Buyers chose them for direct possession, recognizability, gifts, emergency portability, privacy within applicable law, or distrust of financial intermediaries. Sovereign coins often carried stronger resale recognition than generic rounds, while refiner-branded bars could offer lower premiums in normal conditions.
The U.S. Mint's distribution system illustrates the chain. The Mint sells bullion to authorized purchasers, not directly to the public. Those firms distribute into a two-way wholesale and retail market, and the Mint charges the prevailing metal value plus a premium for minting, distribution, and marketing (United States Mint 2026a). By the time a coin reaches a household, more than one institution may have financed, insured, shipped, and hedged it.
A physical buyer should therefore identify the exact product, fine-metal content, condition, packaging, delivery obligation, and buyback market. "One ounce" may mean one troy ounce of fine metal or one troy ounce of an alloy containing less fine metal, depending on the coin. Legal-tender face value is not the market value. A proof or collector version may have a different finish, mintage, and sales channel from a bullion version. The two can look similar while carrying very different premiums.
Allocated and vaulted metal
Allocated storage allows a buyer to own identified metal held by a custodian, often described by refiner, serial number, gross weight, and fineness. It can reduce home-security and shipping problems while preserving a property interest in specified bars. The customer pays storage and insurance, relies on the custodian's controls, and may face minimum withdrawal sizes or fabrication charges to take small units (LBMA 2026b).
The questions are legal as well as operational. Is metal held on the customer's behalf or on the provider's balance sheet? Is it segregated from the custodian's assets? Who is the subcustodian? Are bar lists and audits published? Can the owner inspect, transfer, or withdraw metal? What happens in insolvency? A glossy vault photograph does not answer these questions.
Allocated systems were attractive during 2020 because they offered metal ownership without waiting for retail fabrication. They became attractive again in 2025 as a full one-ounce gold coin became expensive. Fractional digital interfaces could represent small beneficial interests in large bars. The convenience was genuine, but the user's rights depended on contracts and custody rather than the app display.
Unallocated accounts
An unallocated bullion account ordinarily records that an institution owes the customer a quantity of metal; it does not identify specific bars as the customer's property. This structure is efficient for wholesale settlement and can provide low transaction costs. It also creates credit exposure to the account provider. Conversion to allocated metal may require fees, minimums, and availability (LBMA 2026b).
The 2020 disruptions made the distinction practical. A customer with an unallocated balance could have price exposure while retail coins were unavailable, but could not assume an immediate right to receive any desired product. The account might be settled in cash or delivered only in professional bar sizes under its terms. "Backed by metal" is not a complete description of title or redemption.
Exchange-traded products
Physically backed gold and silver exchange-traded products offered the fastest scalable route for many investors. Shares traded through brokerage accounts, and authorized participants created or redeemed large blocks under fund rules. The structure produced record gold ETF inflows in 2020, outflows in 2021-2023, limited net change in 2024, and another major inflow in 2025.
An ETF share is not the same as a coin in a home safe. The investor owns a security. Retail shareholders generally cannot exchange a few shares for a small bar; creation and redemption are conducted in large units by authorized participants. The fund has custody, expense, tax, market-price, and operational terms described in its prospectus. Its share price may trade at a small premium or discount to net asset value (SPDR Gold Trust 2025).
The benefit is liquidity. A holder can buy or sell during exchange hours without shipping and assay. The cost is dependence on brokers, exchanges, custodians, and fund documents. During 2020, this route absorbed enormous demand precisely because it bypassed the small-product bottleneck. That did not make the shares fictitious; it made them a different claim in a different distribution system.
Futures and options
Futures allow producers, refiners, fabricators, dealers, funds, and traders to hedge or take exposure using standardized contracts. They require margin rather than full payment of contract value. This creates leverage: a small adverse move can trigger additional cash requirements or forced liquidation. Most positions are closed or rolled before delivery, while physical delivery follows exchange specifications and approved depositories (CME Group 2026).
For commercial participants, futures were essential during the period. A dealer promising a fixed price for a coin could hedge while waiting for payment and shipment. A miner could lock part of future revenue. An industrial user could manage input costs. For an inexperienced retail trader, however, futures were not a cheaper coin. They were leveraged contracts with expiration, margin, and basis risk.
The February 2021 silver episode demonstrated the difference between retail futures participation and long-term bullion ownership. The CFTC observed sharply elevated retail activity, much of it short term. A trader closing a position that afternoon and a household stacking coins for years both expressed a view on silver, but their market impact, costs, and failure modes differed (CFTC 2021).
Jewelry and metal-bearing objects
Jewelry was both consumption and savings throughout the period. In many countries, buyers chose high-carat pieces with strong resale traditions. The purchase price included design, labor, retail overhead, brand, taxes, and metal. A scrap buyer later paid primarily for recoverable fine metal. The loss of workmanship and brand value was not necessarily fraud; it reflected a change in the product being sold.
Some branded, antique, or artist jewelry should not be sold as scrap without specialist review. The opposite problem also occurred: salespeople described ordinary bullion or mass-produced coins as rare collectibles to justify extreme markups. The correct channel depends on what creates value. Melt material belongs with a refiner or competitive scrap buyer. A genuinely collectible object belongs with a specialist who understands its market.
| Channel | What the buyer owns | Main ongoing cost | Typical exit | Principal risk |
|---|---|---|---|---|
| Coin or small bar | Physical object | Storage, insurance, spread | Dealer, private sale, refiner | Theft, counterfeit, high premium |
| Allocated vault metal | Identified metal or property interest | Custody and withdrawal fees | Transfer, sale through platform, delivery | Custodian and legal-structure risk |
| Unallocated account | Contractual metal balance | Account and conversion charges | Cash sale or conversion | Counterparty and redemption risk |
| Physically backed ETP | Security interest under fund documents | Expense ratio, brokerage, tax | Exchange sale | Market, structure, custody, tracking |
| Futures or options | Standardized derivative | Margin, commissions, roll | Offset, expiration, delivery under rules | Leverage and forced liquidation |
| Jewelry or fabricated object | Metal plus design and use value | Retail markup, care, insurance | Resale as object or scrap | Workmanship premium may not recover |
How People Sold Precious Metals During the Period
Establish recoverable metal before negotiating price
A seller needs the gross weight, expected fineness, and likely recovery. For a standard bullion coin, the mint specification may answer these questions. For jewelry or mixed scrap, hallmarks and electronic tests are screening tools; final settlement may depend on fire assay or refinery results. Stones, springs, solder, steel inserts, weighted bases, dirt, and plating can reduce payable metal.
The basic melt calculation is:
Fine troy ounces = gross troy ounces x fineness
Indicative metal value = fine troy ounces x relevant benchmark
A 10-troy-ounce bar marked .999 silver contains approximately 9.99 fine troy ounces. A 14-karat gold item is theoretically 14/24, or 58.33 percent, gold before allowing for solder, stones, and assay variation. The number is a starting point, not a guaranteed payout. Buyers deduct for refining, hedging, handling, and margin.
Compare executable bids, not advertising language
A strong seller asks multiple buyers for the same type of quote at nearly the same time. The useful comparison states the metal price or fixing used, the payable percentage, all deductions, and the moment the price locks. "Up to 98 percent" is not a quote if the buyer can later classify the item into a lower tier. "We pay more" is not meaningful without a number.
Local shops can provide immediate testing and cash or bank payment, while online dealers may offer deeper national liquidity for recognized bullion. Mail-in refiners can be competitive for large scrap lots but introduce shipping and settlement delay. Auction houses or specialist dealers are appropriate for true numismatic or artistic value. Pawnshops provide speed and convenience but may not maximize metal value. The best channel depends on product and urgency.
During fast markets in 2024-2025, lock timing became critical. A seller should know whether the bid is fixed when a telephone order is created, when tracking shows delivery, when the package is opened, or after assay. The contract should also explain what happens if the seller rejects the final assay or misses a shipping deadline.
Preserve chain of custody and documentation
Invoices, photographs, serial numbers, assay certificates, mint packaging, vault statements, and shipping records reduce uncertainty. They may support authenticity, cost basis, insurance claims, tax reporting, and a future buyer's confidence. Documentation cannot turn a counterfeit into genuine metal, but missing documentation can force the next buyer to repeat work and discount risk.
For institutional bars, provenance became especially important after Russian refinery suspensions and sanctions in 2022. Production date and refiner status could determine whether a bar remained acceptable in a professional market. For retail products, intact packaging can help but should never replace independent testing where risk warrants it.
Separate liquidation from prediction
Many sellers in 2020-2025 faced a practical need rather than a market view: medical costs, business cash flow, inheritance settlement, portfolio rebalancing, or scrap disposal. Waiting for a higher price exposed them to volatility and could increase financing costs elsewhere. Others sold because premiums were unusually strong even if they remained bullish on the metal.
A disciplined sale can be divided. The owner can obtain bids, sell enough to meet the cash need, and retain the balance. This is not always optimal, but it prevents an all-or-nothing forecast from replacing transaction planning. The historical record shows that metals can rise dramatically after a sale and fall dramatically after a purchase. Good execution is measurable even when future price is not.
Premiums, Spreads, and the Cost of Being Wrong
Premiums became the most misunderstood number of the six-year period. A premium can be legitimate compensation for fabrication and distribution, an emergency price for scarce inventory, a collectible value supported by a specialist market, or an abusive markup disguised as rarity. The customer has to determine which.
Three comparisons help. First, compare the item with equivalent products from competing sellers. Second, compare the seller's ask with its own immediate buyback bid. Third, compare the item's premium history in normal and stressed markets. A coin offered 15 percent over spot when comparable products are 5 percent over spot requires an explanation. A seller that refuses to state any repurchase price is revealing something about liquidity.
The following examples are illustrative, not market quotations:
| Purchase ask relative to spot | Immediate bid relative to spot | Approximate benchmark increase needed to break even |
|---|---|---|
| 5% over | 1% under | 6.1% |
| 12% over | At spot | 12.0% |
| 20% over | 5% under | 26.3% |
The calculation assumes the product's premium and discount remain unchanged, which they often do not. If a panic premium disappears, the required benchmark gain is larger. If the coin becomes more desirable, the bid can strengthen. Storage, tax, shipping, card fees, and currency changes can add further hurdles.
Premium compression explains why a buyer can be "right" about the metal and still lose money. Suppose spot silver rises 15 percent after a buyer pays 35 percent over spot for scarce coins. If normal inventory returns and the dealer later bids only 3 percent over spot, the sale may still be below the original purchase price. The metal rose; the product premium fell more.
The reverse can benefit sellers. During a shortage, a widely recognized coin may receive a bid above spot because the dealer can resell it without waiting for new mint supply. That extra value belongs to the product's current liquidity, not to all objects containing the same metal. A plated souvenir, damaged jewelry item, or obscure round does not inherit the premium of a popular bullion coin.
Fraud, Misrepresentation, and Consumer Protection
The period's largest risk was sometimes the salesperson
Price volatility attracts legitimate businesses and predatory sales operations. In September 2020, the CFTC and thirty state regulators alleged that precious-metals dealers had obtained more than $185 million from at least 1,600 people, including more than $140 million in retirement savings. The complaint alleged average overcharges of 100 percent to more than 300 percent above prevailing market prices and claims that ordinary bullion carried rare-coin premiums (CFTC 2020).
A related enforcement action reached a final judgment in 2025. The court ordered Safeguard Metals and its principal to pay $25.6 million in restitution and a $25.6 million civil monetary penalty. Regulators said the scheme had taken approximately $68 million from more than 450 customers, many elderly or retirement-aged, through false claims about traditional retirement assets and inflated precious-metal markups (CFTC 2025).
These cases matter historically because the sales pitch used the same events that drove legitimate demand: pandemic fear, inflation, bank risk, government debt, geopolitical conflict, and retirement insecurity. The macro concern could be reasonable while the offered transaction was abusive. A persuasive case for gold does not validate a 200 percent markup on an ordinary coin.
Warning signs
The CFTC identifies recurring warning signs: guaranteed or unusually high returns, urgency, vague financing, undisclosed storage, missing documentation, unverifiable licensing, and claims that a small down payment controls a much larger metal purchase without meaningful risk. In some schemes, customer money is not used to purchase metal, storage is fictitious, and commissions consume most of the deposit (CFTC 2026a).
Other warning signs are specific to retail bullion:
- The seller will state the ask but not the metal content, spot reference, total markup, or immediate buyback price.
- Common modern coins are described as "exclusive," "semi-numismatic," or "confiscation proof" without a documented secondary market.
- The salesperson urges liquidation of diversified retirement assets but will not provide written risk, fee, and custody terms.
- The company discourages independent appraisal or insists that only it can store or repurchase the product.
- The invoice omits quantity, fineness, product name, unit price, and delivery date.
- A vault program provides account screenshots but no custodian, audit, insurance, bar list, or insolvency explanation.
Counterfeit and assay risk
Counterfeits ranged from plated base-metal pieces to sophisticated bars with altered cores, copied packaging, and false serial numbers. Visual appearance and weight alone may not be enough. Reputable dealers combine dimensions, mass, magnetic response, conductivity, ultrasound, X-ray fluorescence, specific gravity, and destructive assay where appropriate. No single non-destructive test proves every object.
Sellers should not clean coins or remove bars from protective packaging without understanding the effect on resale. Buyers should not treat packaging as proof. A fake can be sealed; a genuine bar can be resealed. For high-value transactions, the counterparty's testing competence and financial responsibility matter as much as the device used.
Responsible sourcing and recycled metal
The 2020-2025 period also raised the standard for lawful and responsible metal. LBMA Good Delivery refiners are subject to responsible-sourcing requirements, independent assurance, and public reporting. Version 9 of the Responsible Gold Guidance clarified due diligence for recycled gold, material origin, ESG risks, cash transactions, auditor rotation, and disclosure (LBMA 2021a).
Recycled metal is not automatically risk free. Stolen jewelry, money laundering, sanctions evasion, and false declarations can enter scrap streams. Dealers need seller identification, transaction records, suspicious-activity controls, and a defensible chain of custody under applicable law. Consumers benefit because a documented market supports resale; they also bear compliance burdens that vary by country.
A Practical Buying and Selling Framework
Before buying
- Define the purpose. Direct possession, short-term trading, long-term diversification, jewelry use, collectible interest, and industrial hedging require different products.
- Identify the legal asset. Determine whether you will own an object, specified vaulted metal, a general account claim, a fund share, or a derivative.
- Price the full ask. Include premium, payment fee, shipping, tax, storage, insurance, and currency conversion.
- Obtain an immediate bid. Ask the seller and at least one competitor what they would pay for the exact product today.
- Calculate the round-trip hurdle. Use the full purchase price and executable resale bid, not spot alone.
- Verify the counterparty. Check registration where applicable, business history, complaints, address, custody relationships, and written terms.
- Plan storage and records. Photograph products, record serial numbers, retain invoices, and protect access information.
- Avoid urgency. A market that has existed for centuries will still exist after time to read the contract.
Before selling
- Identify the item and likely fineness. Do not assume every white metal is silver or every mark is genuine.
- Calculate approximate fine-metal content. Remove stones and nonmetal components only when safe and appropriate.
- Decide whether value is bullion, scrap, numismatic, artistic, or branded. Use the channel that buys that value.
- Request comparable bids. Use the same benchmark time and disclose the same product details to each buyer.
- Ask when price locks and how assay disputes are handled.
- Insure shipment for replacement value and document packing if mailing.
- Confirm payment method, timing, identity requirements, and all deductions.
- Retain settlement statements and records required for tax or legal purposes in the relevant jurisdiction.
Questions every dealer quote should answer
| Question | Why it matters |
|---|---|
| What exact benchmark and timestamp are used? | Prevents a hidden price lag |
| What is the total premium or discount in dollars and percent? | Makes competing products comparable |
| What would you pay to buy this exact item back now? | Reveals the immediate round-trip cost |
| When is the price locked? | Allocates market risk during payment or shipping |
| How is authenticity established? | Clarifies assay cost and dispute process |
| Where is stored metal held, and who owns it legally? | Exposes custody and insolvency risk |
| Are there withdrawal, minimum, cancellation, or market-loss fees? | Identifies costs outside the advertised spread |
| What records will I receive? | Supports resale, insurance, and reporting |
Frequently Asked Questions
Did gold and silver prices double between 2020 and 2025?
Their LBMA annual-average prices almost doubled. Gold rose from $1,769.59 in 2020 to $3,431.54 in 2025, a 93.9 percent increase. Silver rose from $20.55 to $40.03, a 94.8 percent increase. That is not the same as a 94 percent return for every buyer, because entry date, product premium, bid, storage, tax, and currency differed.
Why were physical coins so expensive relative to spot in 2020?
Pandemic closures and transport disruptions constrained refineries, mints, wholesalers, and dealers. Wholesale metal could exist while the desired one-ounce coin was unavailable. The premium paid for scarce fabrication capacity, distribution, inventory, and immediate delivery.
Which precious metal performed best over the full period?
Using the displayed annual averages, silver had the largest percentage increase by a small margin over gold. That ranking changes with daily entry and exit dates and does not include retail spreads. Palladium had the weakest annual-average change despite being the most expensive metal at the start.
Why did palladium fall if it was scarce?
Automotive demand weakened, platinum substituted for some palladium, users released inventory accumulated during earlier disruptions, recycling responded to high prices, and battery-electric vehicle growth changed long-run expectations. Scarcity in one year did not prevent substitution and inventory adjustment.
Is a market deficit the same as a shortage?
No. A deficit means measured demand exceeded current mine and recycling supply during a period. Above-ground stocks can fill the gap. A shortage or squeeze occurs when suitable metal is not available at the required place, form, and time without a sharply higher price. Silver's 2025 liquidity squeeze occurred even though its annual deficit narrowed.
Is an ETF the same as owning bullion?
No. A physically backed ETF can track bullion closely and hold metal through custodians, but a retail shareholder owns a security under fund documents and generally cannot redeem a few shares for a small coin. Physical possession and ETF ownership solve different custody and liquidity problems.
What is a fair premium or spread?
There is no universal percentage. It depends on metal, product size, fabrication, payment, inventory, location, and market stress. Fairness is better assessed through competing quotes, full disclosure, and the seller's immediate repurchase bid. A large undisclosed markup on a common product is a warning sign.
Should jewelry be sold to a bullion dealer?
Plain high-carat jewelry may be appropriate for a competitive scrap buyer or refiner. Branded, antique, artist-made, or gem-set jewelry may be worth more as an object. Obtain specialist review before destroying nonmetal value. Plated items and weighted hollowware may contain little recoverable metal.
Is local or online selling better?
Local selling offers immediate inspection and payment. Large online dealers or refiners may offer deeper liquidity for standard bullion or large scrap lots. The better route is the one with the strongest net executable bid after shipping, insurance, assay, timing, and dispute risk.
What records should a buyer keep?
Keep invoices, payment records, product descriptions, quantities, weights, fineness, serial numbers, photographs, assay documents, custody statements, shipping records, and sale settlements. Recordkeeping supports authentication, insurance, cost basis, compliance, and the next buyer's confidence.
Conclusion
Buying and selling precious metals from 2020 through 2025 was not a simple wager on inflation. The pandemic separated wholesale metal from finished retail products. Reopening restored fabrication but left strong household demand. Inflation and war increased fear just as rate hikes raised the cost of holding non-yielding assets. Central banks changed the gold market. Industrial demand changed the silver market. Substitution and vehicle technology changed palladium. Above-ground stocks delayed platinum's adjustment until 2025.
Across all six years, the most reliable advantage belonged neither to the most bullish buyer nor the most confident seller. It belonged to the participant who understood the object and the exit. Benchmark price, product premium, legal ownership, custody, assay, provenance, financing, and bid were separate variables. The years of shortage made those variables visible; the years of normalization proved that they did not disappear.
The final historical lesson is therefore operational. Precious metal is durable, but a transaction is not. A purchase can be undermined by an undisclosed markup, a weak repurchase market, false storage, leverage, or missing title. A sale can be undermined by poor testing, an inappropriate channel, or a vague price lock. The strongest market is a two-way market in which both sides know what metal exists, who owns it, how it was tested, what every fee is, and what the next buyer will pay.
Research Method and Limitations
The paper uses annual averages and annual supply-demand reports to compare six complete calendar years. Annual data can conceal extreme intrayear moves, and industry organizations may revise historical estimates as mine, recycling, ETF, OTC, and fabrication information improves. Price data describe nominal United States dollars and do not represent local-currency returns. Product premiums are discussed structurally because no single retail-premium series covers every country, dealer, product, and day.
The paper distinguishes final 2025 data published in 2026 from forecasts. It does not project prices beyond December 31, 2025. It also does not provide personalized investment, legal, or tax advice. Readers should verify product terms and local rules at the time of a transaction.
References
- Bureau of Labor Statistics (BLS). 2025. "Consumer Price Index: 2024 in Review." U.S. Department of Labor. Source
- Bureau of Labor Statistics (BLS). 2026. "Consumer Price Index: 2025 in Review." U.S. Department of Labor. Source
- CME Group. 2026. "Gold Futures Overview." Source
- Commodity Futures Trading Commission (CFTC). 2020. "CFTC and 30 States Charge Los Angeles Precious Metals Dealers in Ongoing $185 Million Fraud Targeting the Elderly." September 25. Source
- Commodity Futures Trading Commission (CFTC). 2021. "Global Markets Advisory Committee Meeting Transcript, March 11, 2021." Source
- Commodity Futures Trading Commission (CFTC). 2025. "CFTC, 30 State Regulators Obtain Over $51 Million in Sanctions, Restitution for Victims in California Precious Metals Fraud." Source
- Commodity Futures Trading Commission (CFTC). 2026a. "Precious Metals Fraud." Customer advisory. Source
- Federal Reserve Board. 2020a. "Federal Reserve Issues FOMC Statement." March 15. Source
- Federal Reserve Board. 2020b. "Federal Reserve Announces Extensive New Measures to Support the Economy." March 23. Source
- Federal Reserve Board. 2022a. "Federal Reserve Issues FOMC Statement." March 16. Source
- Federal Reserve Board. 2023. "Federal Reserve Issues FOMC Statement." July 26. Source
- Federal Reserve Board. 2024a. "Federal Reserve Issues FOMC Statement." September 18. Source
- Federal Reserve Board. 2024b. "Federal Reserve Issues FOMC Statement." December 18. Source
- Federal Reserve Board. 2025. "Federal Reserve Issues FOMC Statement." December 10. Source
- Financial Industry Regulatory Authority (FINRA). 2023. "10 Things to Ask When Buying Physical Gold, Silver, or Other Metals." Source
- Johnson Matthey. 2021a. "PGM Market Report February 2021." Source
- Johnson Matthey. 2021b. "PGM Market Report May 2021 Out Now." Source
- Johnson Matthey. 2022. "PGM Market Report 2022." Source
- Johnson Matthey. 2023. "Johnson Matthey Publishes Latest PGM Market Report 2023." Source
- Johnson Matthey. 2024. "Johnson Matthey Publishes Latest PGM Market Report 2024." Source
- Johnson Matthey. 2026. "Johnson Matthey Publishes 2026 PGM Market Report." Source
- London Bullion Market Association (LBMA). 2021. "Winners of LBMA's 2020 Precious Metals Forecast Survey." Source
- London Bullion Market Association (LBMA). 2021a. "LBMA Launches Responsible Gold Guidance Version 9." Source
- London Bullion Market Association (LBMA). 2022. "Winners of LBMA's 2021 Precious Metals Forecast Survey." Source
- London Bullion Market Association (LBMA). 2022a. "Good Delivery List Update: Gold and Silver Russian Refiners Suspended." March 7. Source
- London Bullion Market Association (LBMA). 2023. "Winners of LBMA's 2022 Precious Metals Forecast Survey." Source
- London Bullion Market Association (LBMA). 2023a. "Russian Good Delivery Bars Update." Source
- London Bullion Market Association (LBMA). 2024. "LBMA Annual Precious Metals Forecast Survey Winners 2023." Source
- London Bullion Market Association (LBMA). 2025. "LBMA Annual Precious Metals Forecast Survey 2024: Winners Announced." Source
- London Bullion Market Association (LBMA). 2026a. "LBMA Annual Precious Metals Forecast Survey: Actual 2025 Average Prices." Source
- London Bullion Market Association (LBMA). 2026b. "About Loco London." Source
- Silver Institute. 2021. "Global Pandemic Fueled Renewed Investor Interest in Silver in 2020." Source
- Silver Institute. 2022. "Global Silver Demand Surged in 2021." Source
- Silver Institute. 2023. "Total Global Silver Demand Posts Record High of 1.24 Billion Ounces in 2022." Source
- Silver Institute. 2024. "Silver Industrial Demand Rose 11 Percent to Post a New Record in 2023." Source
- Silver Institute. 2025. "Silver Industrial Demand Reached a Record 680.5 Moz in 2024." Source
- Silver Institute. 2026. "Elevated Lease Rates, Regional Liquidity Tightness, and Robust Investor Interest Resulted in Record Silver Prices in 2025." Source
- SPDR Gold Trust. 2025. "Annual Report on Form 10-K for the Fiscal Year Ended September 30, 2025." U.S. Securities and Exchange Commission. Source
- United States Mint. 2026a. "Bullion Coins." Source
- World Gold Council. 2021a. "Gold Demand Trends Q2 2020: Investment and Supply-Chain Conditions." Source
- World Gold Council. 2021b. "Gold Demand Trends: Full Year 2020." Source
- World Gold Council. 2021c. "Gold Demand Trends: Full Year and Q4 2020 - Investment." Source
- World Gold Council. 2022. "Gold Demand Trends: Full Year 2021." Source
- World Gold Council. 2023. "Gold Demand Trends: Full Year 2022." Source
- World Gold Council. 2024. "Gold Demand Trends: Full Year 2023." Source
- World Gold Council. 2025. "Gold Demand Trends: Full Year 2024." Source
- World Gold Council. 2026a. "Gold Demand Trends: Full Year 2025." Source
- World Platinum Investment Council (WPIC). 2021. "Platinum Quarterly Q4 2020." March 10. Source
- World Platinum Investment Council (WPIC). 2022a. "Faster-than-Expected ACP Semi-Processed Inventory Unwind Increases the Estimated 2021 Platinum Surplus but Reduces the Surplus in 2022." Platinum Perspectives, January 28. Source
- World Platinum Investment Council (WPIC). 2025a. "Structural Deficit." 60 Seconds in Platinum, June 18. Source
- World Platinum Investment Council (WPIC). 2026. "Platinum Quarterly: Final 2025 Supply-and-Demand Assessment." Source