
Direct answer#
The most defensible 25-year conclusion is not that silver will “run out,” nor that one price target is inevitable. It is that the silver market is likely to become larger, more industrial, more recyclable, more technologically elastic and more digitally intermediated by 2051. Electricity networks, vehicles, electronics and solar generation should keep physical demand structurally important. At the same time, the 2026 price shock has already accelerated the forces that limit demand: thrifting, copper substitution, redesigned products, recycling and investor selling.
In the central scenario, annual-average silver prices fall within a broad $55–$95 per troy ounce in 2030, $60–$115 in 2035, $68–$140 in 2040, $77–$177 in 2045 and $93–$245 in 2051, all in nominal future dollars. In constant 2026 purchasing power, the 2051 base range is $50–$132. A substitution-led market can be materially lower; a sustained monetary and supply shock can be far higher. Those extremes are scenario conditions, not expected values.
For buyers and sellers, the practical future will be shaped as much by spreads, storage, taxes, authenticity, custody and product recognition as by spot price. The owner of a high-premium coin may need silver to rise 20% or more merely to break even after costs; a low-cost exchange-traded position may track spot more closely but introduces structure and counterparty risks. The best forecast therefore separates the metal market from the transaction market.
Executive summary#
Silver entered the forecast period in an exceptional regime. The last completed LBMA Silver Price before August 24, 2026 was $69.510 per troy ounce on August 21. The comparable COMEX front-month settlement was $69.466. The 2026 market had already traded far above and below those levels, including a reported January settlement peak above $115. This is not a stable starting point from which to draw a straight line. It is a warning that silver can change regime faster than annual mine supply, fabrication or consumer behavior can adjust.
Metals Focus, in the industry-funded World Silver Survey 2026, estimated 2026 mine supply at 844.1 million ounces (Moz), recycling at 211.3 Moz, total reported supply at 1,066.4 Moz and total demand at 1,112.6 Moz, leaving a projected 46.3 Moz deficit before a separate 30 Moz net exchange-traded-product flow. The same framework forecast industrial fabrication at 639.6 Moz and photovoltaic demand at 151.0 Moz. These are the best coherent market-wide estimates available at the forecast origin, but they remain estimates, not a global physical census (Metals Focus 2026).
The macro backdrop was mixed rather than uniformly bullish. U.S. headline CPI was 3.4% year over year in July, the federal funds target range was 3.50%–3.75%, the 10-year Treasury real yield was 2.40%, and the Federal Reserve’s broad dollar index was close to 119. Inflation and geopolitical risk supported precious-metal demand, but positive real yields and a strong dollar were substantial counterweights (BLS 2026; Federal Reserve 2026a, 2026b; U.S. Treasury 2026).
The long-run industrial case is real but frequently exaggerated. Global solar PV additions exceeded 600 GW in 2025 and the IEA expects solar to dominate renewable-capacity growth through 2030 (IEA 2025, 2026a). Yet silver demand per watt is not fixed. Fraunhofer ISE demonstrated silicon heterojunction cells at 1.4 mg/W and is developing copper-metallized TOPCon, SHJ and tandem routes intended to take silver use below 2 mg/W. Plated TOPCon research has reported silver use around 1.1 mg/W. The largest 2051 demand uncertainty is therefore not “how many solar panels?” alone, but deployment multiplied by silver loading, technology mix, manufacturing yield, module life and recovery (Eckert et al. 2026; Fraunhofer ISE 2025, 2026).
Mine supply is also more elastic in the long run than slogans imply, but much less elastic over five-year periods. A majority of silver is produced as a by-product of lead-zinc, copper and gold mining. A high silver price cannot by itself cause a copper or zinc mine to expand. Primary silver projects face resource conversion, feasibility, finance, permitting, community consultation, construction and ramp-up. La Colorada Skarn, Cordero and Escobal illustrate three different bottlenecks: preliminary economics and capital intensity, undeveloped-project execution, and social/legal uncertainty (Pan American Silver 2026a, 2026b; Discovery Mining 2026).
Recycling becomes the main balancing mechanism in every high-price scenario. It rises from 211.3 Moz in the 2026 industry forecast to 420 Moz in the 2051 base case, 600 Moz in the industrial-acceleration case and 720 Moz in the monetary/supply-shock case. Those values are not forecasts of technical recoverability. They are estimates of material that is collected, concentrated, legally transferable and worth processing. Dispersed electronics, low-silver PV modules and mixed consumer goods may be technically recyclable but economically unrecoverable.
The base case is not a story of uninterrupted deficits. It allows periods in which mine development, recycling and investor dishoarding close the gap. By 2051, its midpoint supply is 1,350 Moz and demand is 1,435 Moz, but the uncertainty range spans a sizable surplus or deficit. The industrial-acceleration case reaches a 394 Moz midpoint deficit by 2051 only because industrial demand grows faster than substitution and supply. That imbalance cannot persist mechanically: it is a signal that higher prices, product redesign, recycling, rationing and project investment would have to intensify.
The monetary/supply-shock case produces the largest nominal ranges, reaching $349–$1,695 per ounce in 2051. Most of that apparent increase reflects both high real metal prices and 4% annual inflation over 25 years. The constant-2026-dollar range is $131–$636. This case requires persistent currency distrust, physical-investment demand, mine disruption, fragmented logistics and limited substitution—not merely one recession or one year of elevated inflation.
The substitution case is equally important. By 2051, it assumes PV loading of about 0.35 mg/W, lower industrial silver use, moderate recycling and weak investment demand. Its nominal annual-average range is $47–$114, equivalent to $27–$66 in 2026 dollars. The lower real range is plausible because a market can grow in physical volume while the marginal value of silver falls through material efficiency.
For retail participants, transaction cost is the most neglected forecast variable. At a $69.51 spot baseline, a sovereign coin bought at a 15% premium, stored at an illustrative 0.6% a year and sold at 98% of spot needs a future spot price around $84 after five years, $86 after ten and $94 after twenty-five just to break even before tax. A larger bar bought at 4% over spot and sold at 99% of spot has a much lower hurdle. An exchange-traded trust with a 0.50% annual sponsor fee has a different, gradually compounding drag. In the illustrative break-even rows, that fee is compounded across the stated holding period and is already reflected in the break-even price. The example assumes no physical-storage charge; brokerage, taxes, bid-ask spread and account fees are excluded. None of these examples establishes the cheapest real product in every country; they show why “silver went up” is not the same as “the owner made money.”
The 2051 market will probably offer instant bids, remote identity checks, insured pickup, machine-assisted authentication and competition among dealers and refiners. Tokenization may reduce settlement friction and permit fractional transfers, but the blockchain does not answer the decisive questions: who owns the bars, whether they are allocated, whether holders have redemption rights, how custody is audited and what happens in bankruptcy. A token can be direct title, an indirect entitlement or a synthetic exposure; the label alone proves nothing (SEC 2026; BIS 2026).
Key findings#
- The forecast origin is a high-volatility regime, not a normal equilibrium. The 2026 benchmark was roughly 74% above the 2025 London annual average reported by Metals Focus. Long-term models should mean-revert some of that shock unless the underlying regime persists.
- PV silver loading is the highest-leverage industrial variable. In the model, 2,100 GW of annual additions at 1.2 mg/W uses about 81 Moz; the same deployment at 5 mg/W would use about 338 Moz.
- Deficits do not map one-for-one to price. Inventory releases, ETP disinvestment, coin/bar selling, recycling, substitution and fabrication cuts can bridge annual gaps.
- The world cannot be described by one “above-ground silver” number. Exchange-registered stocks, eligible stocks, ETP metal, dealer inventories, private coins, jewelry, industrial products and dispersed waste have different availability.
- Mine supply responds slowly and often indirectly. By-product economics and non-price constraints make a five-year supply response uncertain even when silver is expensive.
- Recycling is price-sensitive but concentration-sensitive. High-grade manufacturing scrap responds quickly; low-grade consumer and PV waste needs collection systems, scale and favorable treatment economics.
- Investment demand can dominate short-run price without dominating annual fabrication. ETP flows and futures positioning alter liquidity and marginal price formation; they do not necessarily create a retail coin shortage.
- A retail shortage is not automatically a wholesale shortage. Coin blanks, mint capacity, packaging, transport and dealer inventory can fail while 1,000-ounce bars remain available.
- Dealer economics depend on turnover and hedging, not a rising price. An unhedged dealer can lose money in a falling market; a well-hedged dealer earns spreads and service fees.
- Real and nominal prices diverge dramatically by 2051. At 2.5% inflation, a nominal $245 in 2051 is about $132 in 2026 purchasing power.
- Tokenized silver can improve transferability without improving ownership quality. Legal title and redemption terms remain primary.
- The base case is deliberately broad. Twenty-five-year precision beyond ranges would be false confidence.
Table of contents#
Scope and methodology#
This study fixes the origin at August 24, 2026 and the endpoint at August 24, 2051. It does not silently roll the starting date forward. Observed data are dated at or before the origin. Forecasts are presented at 2030, 2035, 2040, 2045 and 2051. The partial years 2026 and 2051 are not treated as directly comparable full calendar years.
The model has three layers.
Layer 1: physical balance. Available supply is mine production plus recycling, hedging or inventory-related flows and other documented supply. Demand is industrial fabrication, jewelry, silverware, photography and coin/net bar demand. ETP flows are kept separate because providers classify them differently and because a purchase of an ETP share is not itself fabrication. The modeled balance is a diagnostic, not proof of a missing quantity of metal.
Layer 2: price regime. Physical balance is combined with real interest rates, inflation, dollar conditions, gold-market behavior, investment flows, marginal costs and historical regime behavior. No single regression is treated as stable for 25 years. The model therefore uses broad scenario bands rather than a spurious point estimate.
Layer 3: transaction economics. Retail and institutional users experience spot through premiums, bid–ask spreads, taxes, financing, custody, shipping, insurance, testing, refining and product recognition. A holder’s return is modeled separately from the metal’s quoted price.
The nominal conversion is:
Nominal future price = real 2026-dollar price × (1 + assumed inflation rate)^(year − 2026)
The solar model is:
PV silver demand in Moz = annual installations in GW × silver loading in mg/W × 0.0321507466
The conversion follows from one gigawatt equaling one billion watts and one metric tonne equaling 32,150.7466 troy ounces. The formula intentionally excludes module replacements and recycling until those quantities are modeled separately.
Market ranges widen with the horizon. Supply and demand uncertainty is 4% around the base midpoint in 2030 and 12% by 2051; scenario uncertainty is wider in high-demand and shock cases. Price ranges widen more because price is a marginal, financial variable, not merely the quotient of annual demand and supply.
Evidence labels#
Every major statement belongs to one of seven categories:
- Observed fact: directly measured or officially reported before the origin.
- Industry estimate: a market-wide estimate built from surveys, trade data and company information.
- Historical relationship: a pattern observed in earlier regimes that may not persist.
- Scenario assumption: a condition imposed to create an internally consistent future.
- Model output: a calculation produced from assumptions.
- Author inference: a reasoned interpretation of evidence.
- Low-confidence speculation: a possibility retained for monitoring but not used as a central input.
The bibliography identifies the external sources used for the dated baseline. Scenario assumptions and outputs are presented in the tables below; this first edition does not include a public model or data file.
The August 2026 baseline#
| Metric | Value | Date | Interpretation |
|---|---|---|---|
| LBMA benchmark | $69.510/oz | Aug. 21, 2026 | Last completed benchmark before forecast origin |
| COMEX front-month settlement | $69.466/oz | Aug. 21, 2026 | Futures settlement, not retail price |
| Mine supply | 844.1 Moz | 2026F | Metals Focus / Silver Institute |
| Recycling supply | 211.3 Moz | 2026F | High-price response already material |
| Total reported supply | 1,066.4 Moz | 2026F | Includes hedging and official sales |
| Industrial demand | 639.6 Moz | 2026F | PV is included within E&E |
| Photovoltaic demand | 151.0 Moz | 2026F | Subset, not additive to E&E |
| Jewelry | 159.4 Moz | 2026F | Price-sensitive, India especially important |
| Silverware | 33.5 Moz | 2026F | Price-sensitive and culturally concentrated |
| Photography | 22.5 Moz | 2026F | Long decline, not zero |
| Coin and net bar demand | 257.6 Moz | 2026F | Physical investment |
| Total demand | 1,112.6 Moz | 2026F | Before separate net ETP flow |
| Market balance | −46.3 Moz | 2026F | Sixth consecutive projected deficit |
| Net ETP investment | 30.0 Moz | 2026F | Separate financial-investment flow |
| London vault silver | 28,213 t (~907 Moz) | Jul. 31, 2026 | Not all free or unencumbered |
| SLV metal in trust | 491.75 Moz | Aug. 21, 2026 | One identifiable ETP holding |
| U.S. CPI | 3.4% y/y | Jul. 2026 | Headline CPI |
| Federal funds target | 3.50%–3.75% | Jul. 29, 2026 | Positive nominal policy rate |
| 10-year real Treasury yield | 2.40% | Aug. 21, 2026 | Historically a headwind to non-yielding metal |
What the baseline does—and does not—show#
The 46.3 Moz 2026 deficit is about 4% of modeled total demand. It is meaningful but not equivalent to a 46.3 Moz failure to settle transactions. A market balance can be covered by inventories, investor selling, changes in producer hedging, product destocking or statistical residuals. A deficit that persists for years raises the probability of tightness, higher recycling and substitution, but it does not specify the timing or size of a price response.
The London vault figure of 28,213 tonnes is approximately 907 Moz. It must not be added to the 491.75 Moz held by SLV as though they were independent pools: much ETP metal is stored within London vault networks. Nor is all London metal readily available to a new buyer. It can be allocated to ETPs, customers or financing structures. Conversely, it is wrong to assume none of it can respond to price. Shares can be redeemed or sold, owners can disinvest, and metal can move between locations when arbitrage and logistics permit (LBMA 2026a; BlackRock 2026).
COMEX registered and eligible categories answer a narrower question. Registered metal has an exchange warrant and can be used for delivery. Eligible metal meets exchange specifications but is not currently warranted. Eligible metal is not guaranteed to become registered, but neither is it unusable. A credible inventory-stress diagnosis needs the trend in registered stocks, warrant cancellations, spreads, lease rates, delivery demand, bar-location constraints and the status of refiners—not one screenshot.
The same caution applies to private holdings. Coins and bars in households are often unavailable at ordinary prices but can become supply when prices rise, personal finances change or trust in the market returns. Jewelry and silverware have both metal and cultural value. Industrial products may be recoverable only after years of use. Dispersed silver in landfills may be geologically present yet economically irrelevant.
The Silver Availability Ladder#
The market should be read as a ladder:
- geologically present silver;
- identified mineral resource;
- economic reserve;
- permitted and financed production;
- mine output and refinery feed;
- refined wholesale metal;
- exchange-deliverable or allocated vault inventory;
- dealer or mint inventory;
- finished retail product;
- privately held investment metal;
- recoverable scrap.
A shortage at step nine can coexist with abundance at step six if minting or logistics are constrained. A large resource at step two does not solve a shortage at step seven. Headlines become misleading when they jump between rungs.
How silver prices are formed#
Silver has no single universal “spot price.” Price discovery occurs across overlapping venues and products.
The London over-the-counter market is the principal wholesale hub for unallocated metal. The LBMA Silver Price is established through an electronic auction administered by ICE Benchmark Administration beginning at noon London time. Participants submit buy and sell volumes through successive rounds until the imbalance falls within tolerance. The benchmark is expressed in U.S. dollars per troy ounce for unallocated loco London silver. It is used for physical contracts, valuation, hedging and financial products (LBMA 2026b; ICE 2026).
COMEX futures establish transparent forward prices in standardized contracts. Most futures positions are closed or rolled rather than settled with bars, which is normal for a hedging market. A miner may sell futures to reduce price risk; a fabricator may buy; a market maker may arbitrage London and New York; a fund may take directional exposure. High gross notional turnover does not imply that every contract demands a separate bar. Clearing and margin are designed to net obligations.
Shanghai markets matter because China is a major refiner, producer, solar manufacturer and industrial consumer. Local premiums, exchange rules, capital controls, import policy and currency differences can create regional dislocations. Arbitrage is never frictionless: bar specifications, taxes, shipping, financing, sanctions and refinery accreditation matter.
The marginal price responds to more than annual fabrication. Important variables include:
- the U.S. dollar and real interest rates;
- gold-market direction and precious-metal allocation;
- ETP creations and redemptions;
- futures positioning and options hedging;
- producer hedging and consumer procurement;
- lease rates and availability of nearby metal;
- exchange inventory and warehouse location;
- retail demand, mint capacity and wholesale-bar conversion;
- mine disruptions, sanctions and transport constraints;
- expected substitution and recycling.
Documented misconduct must be separated from unsupported universal claims. The CFTC found spoofing and manipulation in precious-metals futures and imposed a record $920.2 million resolution on JPMorgan in 2020. It also sanctioned Deutsche Bank for manipulation and spoofing between 2008 and 2014 (CFTC 2018, 2020). These cases establish that illegal behavior occurred. They do not establish that every futures move is artificial or that silver has been permanently held below an unknowable “true” price. A serious analysis acknowledges both enforcement evidence and the legitimate price-discovery and hedging functions of derivatives.
The four scenarios#
| Variable | Base case | Industrial acceleration | Substitution and efficiency | Monetary and supply shock |
|---|---|---|---|---|
| Long-run inflation | 2.5% | 2.7% | 2.2% | 4.0% |
| PV deployment | Strong | Very strong | Strong | Moderate/disrupted |
| PV silver loading | Falls to 1.2 mg/W by 2051 | Falls slowly to 1.8 mg/W | Falls to 0.35 mg/W | Falls to 1.2 mg/W |
| Industrial demand | Gradual growth | Rapid growth | Declines after thrifting | Weak first, then recovers |
| Mine supply | Slow expansion then plateau | Expansion with high prices | Closures and underinvestment | Disruption then partial recovery |
| Recycling | Rises steadily | Rises strongly | Moderate, limited by low price | Surges with price/stress |
| Physical investment | Cyclical, moderate | Elevated | Weak | Very high |
| Market structure | Functional, volatile | Tight but functioning | Liquid with surplus episodes | Fragmented, episodically stressed |
Scenario A — Base case#
The base case assumes functioning global commodity markets, 2.5% long-run U.S. inflation, gradual mine investment, rising recycling, moderate physical investment and substantial but incomplete industrial thrifting. It is the central reference, not a claim that its midpoint is “most likely” in a statistically measured sense.
Mine supply rises from 844.1 Moz in the 2026 industry forecast to a modeled 870 Moz in 2030, peaks around 920 Moz in 2045 and eases to 910 Moz in 2051 as grades and mature assets offset new projects. Recycling rises to 420 Moz by 2051. Industrial demand reaches 900 Moz, but PV silver demand falls after 2030 because loading per watt declines faster than installations rise. Coin and bar demand remains cyclical around 220–260 Moz.
The base midpoint moves from a near-balanced market in 2030 toward an 85 Moz deficit by 2051. That should not be read as a mechanically cumulative 25-year shortage. The response loop—higher prices, more scrap, less fabrication and project development—is embedded in the wide balance range. The scenario is invalidated if copper metallization reaches mass adoption much faster than assumed, if primary and by-product mine supply exceeds 1.1 billion ounces sustainably, or if persistent monetary stress drives investment demand far beyond the modeled band.
Scenario B — Industrial demand acceleration#
This scenario combines faster solar deployment, electrification, data-center construction, grid modernization and automotive electronics with slower silver thrifting. It is not “AI demand” as a vague standalone block. AI enters indirectly through servers, power distribution, cooling controls, switches, contacts, backup systems and grid expansion; only documented silver-bearing components are counted within broader electrical demand.
PV loading falls from current industrial levels but remains 1.8 mg/W in 2051 rather than 1.2 mg/W or lower. Annual PV additions reach 3,200 GW. Gross PV silver demand is therefore about 185 Moz in 2051 even after major thrifting. Industrial demand reaches 1,380 Moz, while total supply reaches a 1,635 Moz midpoint through mine expansion and 600 Moz of recycling.
The resulting 394 Moz midpoint deficit is not a stable equilibrium. It represents a market under sustained pressure, with elevated prices required to induce additional scrap, accelerate redesign and ration low-value uses. The price band rises to $245–$615 nominal in 2051, equivalent to $126–$316 in 2026 dollars. The scenario is confirmed by slow progress below 2 mg/W, repeated project delays, rising industrial procurement premiums and persistent inventory drawdowns. It is invalidated by rapid copper adoption or a much stronger supply response.
Scenario C — Substitution and efficiency#
This case assumes that high prices do what commodity economics predicts: they change products and behavior. PV reaches 0.35 mg/W by 2051 through copper plating, low-silver pastes and process redesign. Electrical uses retain silver where reliability is decisive but thrift it elsewhere. Jewelry, silverware and investment are weaker. Mine supply falls to 700 Moz because low real prices close high-cost production and reduce exploration; recycling also remains modest because scrap economics are less attractive.
Total modeled demand declines to 937 Moz by 2051, while supply is 975 Moz. The market runs a modest surplus at the midpoint, which feeds back into lower prices and mine rationalization. The 2051 price range is $47–$114 nominal and $27–$66 in 2026 dollars.
This is not a prediction that silver becomes technologically obsolete. Silver remains the best electrical conductor and has valuable optical, catalytic, brazing, medical and antimicrobial properties. The scenario says that industries can preserve those functions while reducing silver mass. It becomes more plausible when high prices persist long enough to justify new equipment, process qualification and warranty testing.
Scenario D — Monetary and supply shock#
The stress case combines 4% long-run inflation, currency instability, geopolitical fragmentation, sanctions, mine disruptions, high physical-investment demand and episodic exchange or transport stress. It does not require a permanent collapse of the dollar or commodity exchanges. It requires repeated disruptions severe enough that private holders demand more metal while producers and logisticians deliver less reliably.
Mine supply falls to 760 Moz in 2035 before recovering to 850 Moz by 2051. Recycling surges to 720 Moz because high prices mobilize silverware, jewelry, industrial residues and investment metal. Physical coin and bar demand rises to 700 Moz. Industrial demand is initially constrained by recession and price but later grows.
The nominal annual-average range reaches $349–$1,695 in 2051, with possible year-end observations outside that band. The real range is $131–$636. The upper end is intentionally extreme and low-confidence. It would require persistent, not momentary, stress. If inflation normalizes, real yields remain positive, logistics function and investment metal returns to market, the case rapidly loses plausibility.
Milestone price, supply and demand forecasts#
| Year | Scenario | Nominal annual-average range | Real 2026-dollar range | Supply | Demand | Balance (supply minus demand) | Confidence |
|---|---|---|---|---|---|---|---|
| 2030 | Base case | $55–$95 | $50–$86 | 1,085–1,175 Moz | 1,090–1,180 Moz | -95 to 85 Moz | Medium |
| 2035 | Base case | $60–$115 | $48–$92 | 1,123–1,267 Moz | 1,127–1,271 Moz | -148 to 140 Moz | Medium-low |
| 2040 | Base case | $68–$140 | $48–$99 | 1,159–1,361 Moz | 1,167–1,371 Moz | -212 to 194 Moz | Low |
| 2045 | Base case | $77–$177 | $48–$111 | 1,174–1,436 Moz | 1,210–1,480 Moz | -306 to 226 Moz | Low |
| 2051 | Base case | $93–$245 | $50–$132 | 1,188–1,512 Moz | 1,263–1,607 Moz | -419 to 249 Moz | Very low |
| 2030 | Industrial demand acceleration | $76–$126 | $68–$113 | 1,086–1,224 Moz | 1,185–1,337 Moz | -251 to 39 Moz | Medium-low |
| 2035 | Industrial demand acceleration | $102–$183 | $80–$144 | 1,155–1,355 Moz | 1,330–1,562 Moz | -407 to 25 Moz | Low |
| 2040 | Industrial demand acceleration | $129–$258 | $89–$178 | 1,228–1,502 Moz | 1,477–1,805 Moz | -577 to 25 Moz | Low |
| 2045 | Industrial demand acceleration | $174–$378 | $105–$228 | 1,316–1,674 Moz | 1,599–2,035 Moz | -719 to 75 Moz | Very low |
| 2051 | Industrial demand acceleration | $245–$615 | $126–$316 | 1,390–1,880 Moz | 1,725–2,333 Moz | -943 to 155 Moz | Very low |
| 2030 | Substitution and efficiency | $40–$75 | $37–$69 | 1,006–1,134 Moz | 939–1,059 Moz | -53 to 195 Moz | Medium |
| 2035 | Substitution and efficiency | $38–$74 | $31–$61 | 961–1,129 Moz | 897–1,053 Moz | -92 to 232 Moz | Medium-low |
| 2040 | Substitution and efficiency | $38–$80 | $28–$59 | 914–1,116 Moz | 859–1,049 Moz | -135 to 257 Moz | Low |
| 2045 | Substitution and efficiency | $41–$91 | $27–$60 | 876–1,114 Moz | 832–1,058 Moz | -182 to 282 Moz | Low |
| 2051 | Substitution and efficiency | $47–$114 | $27–$66 | 829–1,121 Moz | 796–1,078 Moz | -249 to 325 Moz | Very low |
| 2030 | Monetary and supply shock | $95–$220 | $81–$188 | 1,008–1,232 Moz | 1,148–1,404 Moz | -396 to 84 Moz | Low |
| 2035 | Monetary and supply shock | $125–$366 | $88–$257 | 1,035–1,345 Moz | 1,154–1,498 Moz | -463 to 191 Moz | Low |
| 2040 | Monetary and supply shock | $170–$613 | $98–$354 | 1,105–1,525 Moz | 1,197–1,653 Moz | -548 to 328 Moz | Very low |
| 2045 | Monetary and supply shock | $236–$944 | $112–$448 | 1,148–1,722 Moz | 1,221–1,831 Moz | -683 to 501 Moz | Very low |
| 2051 | Monetary and supply shock | $349–$1,695 | $131–$636 | 1,185–1,975 Moz | 1,270–2,116 Moz | -931 to 705 Moz | Very low |
Reading the forecast table#
The price columns are annual-average bands. A year-end price can be outside them, especially in the shock case. The supply and demand ranges are not confidence intervals in the statistical sense; they are structured uncertainty bands around scenario assumptions.
The base 2030 range of $55–$95 overlaps both lower and higher prices than the August 2026 benchmark. That is deliberate. A 2026 price near $70 can be followed by a higher 2030 average if industrial and investment demand remain strong, or a lower average if the 2026 shock stimulates scrap, substitution and disinvestment. A forecast that only rises because its starting point is high has no analytical value.
By 2051, nominal ranges appear large because 25 years of inflation compound. At 2.5% annual inflation, the price level is about 85% higher than in 2026. A $132 real price becomes roughly $245 nominal. Readers comparing 2051 prices with the 1980 or 2011 peaks must therefore compare both nominal and inflation-adjusted values.
The market-balance bands span surplus and deficit in several rows. That is not indecision; it reflects the endogenous response of a commodity market. A projected deficit tends to raise price, which raises recycling, encourages mine investment, reduces price-sensitive demand and accelerates substitution. A projected surplus does the reverse. The farther the horizon, the more those feedbacks matter.
Silver supply through 2051#
Mine production#
Silver mine supply is frequently discussed as though every ounce comes from a “silver mine.” It does not. USGS descriptions and industry balances show that a large majority is recovered with lead, zinc, copper or gold. That structure has four consequences.
First, the silver price is often a secondary variable in investment decisions. A copper project may proceed because copper economics are attractive and produce silver regardless of a weak silver price. A lead-zinc closure can remove silver even during a silver rally. Second, reserve grades and recovery rates matter as much as ore tonnes. Third, smelter capacity, concentrate terms and metallurgical recovery can constrain payable silver. Fourth, a forecast that adds announced silver resources without modeling the host-metal market is unreliable.
The supply pipeline has distinct gates:
- Resource: a geologically estimated concentration with reasonable prospects.
- Reserve: the economically mineable part supported by modifying factors.
- Permitted project: approvals exist, often with conditions.
- Financed project: capital is committed on acceptable terms.
- Construction: physical development has begun.
- Commissioning: plant and mine are being tested.
- Commercial production: output is sustained near design.
- Payable refined silver: concentrate or doré has been treated and metal credited.
At each gate, ounces can disappear through dilution, recovery, cost escalation, delay or redesign. Higher prices improve project economics but can also raise labor, steel, fuel, reagent and royalty costs. Governments may revise fiscal terms. Communities can demand additional consultation. Water and tailings constraints can become binding.
Project examples: why supply lags#
La Colorada Skarn, Mexico. Pan American reported an indicated skarn resource of 265.4 million tonnes containing 309 Moz silver plus substantial zinc and lead. It also stated explicitly that mineral resources are not reserves and do not have demonstrated economic viability. The preliminary economic assessment contemplated a long production profile and major capital. The project illustrates geological scale, by-product credits and the distance between a resource model and saleable metal (Pan American Silver 2026a).
Cordero, Mexico. Discovery Mining describes Cordero as a development-stage project with a feasibility profile of roughly 14 Moz silver annually in years 1–10. Even a feasibility-stage project still faces financing, detailed engineering, procurement, construction, commissioning and market conditions. Its relevance to a 2030 forecast is much higher than its relevance to 2027 supply (Discovery Mining 2026).
Escobal, Guatemala. Escobal has a large reserve base but operations have been paused since 2017. Pan American’s second-quarter 2026 update stated that the ILO 169 consultation continued with no timeline for conclusion and no restart date. Escobal demonstrates why a technically established mine cannot be counted as future supply until legal and social conditions support operation (Pan American Silver 2026b).
These examples support a broad 2051 supply range but a cautious 2030 response. They also explain why project-level tracking is superior to multiplying national reserves by a chosen extraction rate.
Geographic outlook#
Mexico should remain central because it combines existing districts, primary silver mines and large development projects. Its upside depends on fiscal policy, permitting, security, community relations, water and project finance. Mexico’s concentration creates both scale and jurisdiction risk.
China has a dual role as producer and dominant industrial processor. Much output is associated with lead-zinc and other base metals. Domestic industrial policy, solar manufacturing, environmental controls and trade measures can affect both sides of the balance.
Peru, Bolivia and Chile contain large polymetallic systems. Peru’s permitting and community relations are decisive; Chile’s copper cycle can increase by-product silver even where silver is not the investment thesis; Bolivia has geological potential but financing and policy constraints.
Poland is important through large copper-silver operations. Its supply is tied more closely to copper mining and processing than to the standalone silver price.
Australia, Canada, the United States, Argentina and Kazakhstan offer diversified project pipelines, but no single jurisdiction eliminates the long lead time from discovery to production. Russia may remain a substantial producer while sanctions and trade fragmentation complicate market access and data quality.
The base case reaches only 910 Moz of mine production by 2051, about 8% above the 2026 industry forecast. The industrial case reaches 1,010 Moz, requiring both primary projects and strong base-metal output. The substitution case falls to 700 Moz because low real prices close marginal mines and discourage exploration. The shock case recovers to 850 Moz after disruption because high prices eventually overcome some constraints.
Primary versus by-product supply#
Primary mines are more responsive to silver prices but represent a smaller share. Their advantages are management attention, clearer price exposure and the ability to optimize around silver. Their disadvantages include revenue concentration and vulnerability to grade decline.
By-product operations can have lower apparent silver costs because host-metal revenue absorbs much of the mining expense. Yet “negative cost” language is accounting, not geology. If the host mine closes, its silver disappears regardless of the reported by-product cost. Long-run silver supply therefore depends on copper electrification, zinc use, lead demand, gold prices and smelter economics.
The industrial-acceleration scenario contains a partial self-balancing mechanism: faster electrification raises copper investment, which can add silver by-product output. The same energy transition that increases silver demand can therefore increase supply. The size and timing of that offset are uncertain because ore grades, processing recovery and project locations differ.
Recycling and the circular economy#
Recycling is not one market. It is a series of feedstocks with different concentration, ownership and collection economics.
Manufacturing scrap is the easiest. It is concentrated, known, generated in regular lots and often subject to toll-refining agreements. Recovery can be high and rapid.
Photographic recovery is mature and historically important, but the available stream has declined with analog imaging. It remains relevant in specialized medical, industrial and artistic uses.
Jewelry and silverware form a large, price-sensitive reservoir. High prices increase selling, but workmanship, sentiment, religious use and inheritance can keep objects out of the melt stream. Hallmarks simplify valuation; stones, weighted handles, solder and mixed alloys complicate it.
Coins and bars are technically not “recycled” when resold as investment products, but investor dishoarding is economically equivalent to secondary supply. Recognized bullion can move back to dealers without refining. Damaged or obscure material may be melted.
Electronics contain silver in contacts, pastes, switches and solders. Recovery depends on collection, dismantling, concentration and integrated smelting. A phone may contain recoverable silver but too little to process alone. The economic unit is a large, mixed stream, not one device.
Solar modules create a delayed recycling pool. Modules installed in the late 2020s and 2030s will generally remain in service for decades unless damaged, repowered or prematurely retired. Lower loading per watt means future modules may contain less silver than older ones. Recycling can still be material because installation volume is enormous, but silver is only one part of module economics.
Automotive scrap offers organized collection but complex component separation. Vehicle electronics and contacts can enter established metal-recovery systems; exact silver recovery depends on design and dismantling.
Landfill mining is possible in principle but is not a central 2051 supply assumption. The grade, location, contamination and permitting of waste determine whether recovery makes sense.
Technical versus economic recoverability#
A material is technically recoverable when a process can separate silver. It is economically recoverable when the value of recovered products exceeds collection, transport, sorting, energy, treatment, compliance and capital costs at an acceptable risk-adjusted return.
The distinction is critical for low-loading PV. At 0.35 mg/W, one gigawatt of modules contains only 0.35 tonnes of silver. A recycler must process vast panel mass to capture that metal. Aluminum, glass, copper and silicon revenues, producer-responsibility payments and landfill fees may make the system viable; silver alone may not.
Recycling increases in the model when at least three conditions align:
- sustained, not momentary, high metal prices;
- reliable collection and traceability;
- technology or scale that reduces treatment cost.
Regulation can shift the economics through extended-producer-responsibility rules, take-back mandates, recycled-content standards and restrictions on informal processing. Poorly designed rules can also raise cost without improving recovery.
Recycling model#
The base case rises from 211.3 Moz in 2026 to 250 Moz in 2030, 330 Moz in 2040 and 420 Moz in 2051. This is a compound growth rate below 3% and assumes improving collection rather than a technological miracle.
The industrial case reaches 600 Moz in 2051 because high prices and large end-of-life streams support investment in recycling capacity. The shock case reaches 720 Moz because households and institutions liquidate more metal and refiners run at high utilization. The substitution case reaches only 265 Moz because low real prices make marginal feed uneconomic.
These estimates must not be interpreted as a fixed percentage of “all above-ground silver.” The denominator is unknowable and economically heterogeneous. A better dashboard tracks feedstock-specific quantities, treatment charges, scrap payouts and collection rates.
Industrial demand#
| Application | Substitution difficulty | Thrifting potential | Price sensitivity | Recycling potential | 2051 outlook |
|---|---|---|---|---|---|
| PV metallization | High after redesign | Very high | High | Medium–high | Likely lower silver intensity; total demand depends on deployment |
| Electrical contacts/switches | Medium | Medium | Low–medium | Medium | Steady growth; silver retained in high-reliability uses |
| Power electronics/grid | Medium | Medium | Low–medium | Medium | Positive but smaller than broad electrification rhetoric suggests |
| Automotive electronics | Medium | Medium | Medium | High | Growth with EVs, offset by architecture changes and thrifting |
| Medical/antimicrobial | Medium | Medium | Low in critical uses | Medium | High-value niche, not a bulk-market driver |
| Brazing and solders | Medium | Medium | Medium | High | Cyclical industrial growth |
| Jewelry | High | Medium | High | High | Income growth versus price elasticity |
| Silverware | High | Medium | High | Very high | Flat to modest growth; large recycling response at high prices |
| Photography | Medium | Low | Medium | Very high | Long decline toward a specialist floor |
| Coins and bars | No material substitute | Low | Very high | Very high | Cyclical and regime-dependent |
Electronics and electrical uses#
Silver’s conductivity, contact reliability, corrosion behavior and performance under arcing make it valuable in switches, relays, contacts, conductive inks, pastes and power systems. The strongest long-run uses are those in which failure is expensive and the silver mass is a small share of total product cost. In those applications, demand is relatively insensitive to metal price.
Consumer electronics are more elastic. Manufacturers can reduce coating thickness, redesign contacts, consolidate components or substitute materials where reliability permits. Unit sales can grow while silver use per unit falls. A credible forecast therefore needs both device volume and intensity.
Semiconductor growth supports silver indirectly through packaging, power electronics, factory equipment and electrical infrastructure. It does not justify a separate, enormous “AI silver” number without a bill of materials. Data centers use switchgear, backup power, connectors, server hardware and network equipment, but direct silver intensity per megawatt is not reported consistently. This paper includes such activity within broader electrical demand rather than adding an unsupported AI block.
Electric vehicles and transportation#
The IEA reported more than 20 million electric cars sold in 2025, one-quarter of new car sales, and projected around 23 million in 2026. Its exploratory scenarios put EVs near half of global car sales in 2035 (IEA 2026b). The direction is supportive for silver because EVs use more power electronics, sensors, charging controls and high-current switching than simple internal-combustion vehicles.
Exact grams per vehicle are uncertain. The Silver Institute, drawing on Oxford Economics, cites roughly 25–50 grams per EV and higher average content than internal-combustion vehicles. Those estimates are useful as ranges but not as constants. A compact battery electric vehicle, premium autonomous vehicle, plug-in hybrid, bus and truck have different architectures. Engineers also thrift expensive materials. The model therefore forecasts automotive demand inside the industrial total rather than multiplying all vehicle sales by one number.
Charging infrastructure adds contacts, relays, metering and grid equipment. Rail, aviation and maritime electrification are smaller in unit count but can be high-value. Transportation demand is likely to grow through 2040, then depend more on fleet saturation and component intensity.
Grid modernization and electrification#
The IEA estimates that annual grid investment must rise about 50% from roughly $400 billion by 2030 and notes 5–15-year grid-development timelines (IEA 2026c). Grid investment is not the same as silver demand. Most expenditure goes to copper, aluminum, steel, transformers, civil works, software and labor. Silver appears in contacts, breakers, switchgear, control systems and power electronics.
The correct inference is moderate: a larger, more complex grid expands the installed base of silver-bearing components, but no credible evidence supports applying a fixed silver intensity to total grid dollars. This paper treats grids as a durable positive driver within electrical demand, not an independent hundreds-of-millions-of-ounces claim.
Heat pumps, industrial electrification, charging networks and resilient microgrids have a similar relationship. Their direct silver content is distributed across equipment. Demand is meaningful in aggregate, but it must be reconciled with the electrical/electronics category to avoid double counting.
Medical, antimicrobial and chemical uses#
Silver is used in wound care, coatings, catheters, medical devices, water treatment, filtration and antimicrobial textiles. These applications can command high prices because silver provides a function rather than bulk mass. Yet their total tonnage is small relative to PV and electronics.
Growth depends on clinical evidence, regulation, environmental discharge, resistance concerns and competing technologies. Silver can be retained in high-value wound care while falling in consumer products that make weak antimicrobial claims. The 2051 model keeps these uses in “other industrial” demand and does not elevate them into a primary market driver.
Silver catalysts in ethylene oxide production are another specialized industrial use. The metal often remains in long-lived catalyst systems and can be recovered. Chemical capacity cycles can create lumpy fabrication demand, but net consumption differs from gross loading because of recovery.
Jewelry and silverware#
Jewelry demand is a competition among income growth, fashion, gifting, culture and price. India is especially important for jewelry, silverware, rural savings and festivals. China combines jewelry demand with large industrial fabrication. The United States and Europe have deep branded and designer markets; the Middle East, Southeast Asia and Latin America add demographic and cultural growth.
High prices reduce weight, shift consumers toward plated or alternative materials and mobilize old jewelry. They can also increase the prestige of existing objects. Jewelry demand therefore does not fall linearly with price.
The base case grows jewelry fabrication from 159.4 Moz in the 2026 industry forecast to 220 Moz in 2051, below global income growth because product weight falls. The industrial case reaches 240 Moz. The substitution case reaches 185 Moz. The shock case initially falls because extreme prices damage affordability, then recovers with nominal income.
Silverware is more price-elastic and more recyclable. The base case reaches only 40 Moz by 2051. Household flatware, religious objects and ceremonial items remain culturally significant, but plated products and lighter designs constrain metal demand.
Photography#
Photography falls from 22.5 Moz in the 2026 industry forecast to 15 Moz in the 2051 base case. It does not reach zero. Film, fine-art photography, archival products, x-ray and industrial imaging can maintain a specialist floor. Recovery from photographic chemicals remains one of the more established recycling systems.
Solar demand model#
Solar is the demand category most likely to be both underestimated and overestimated.
The IEA estimated more than 600 GW of global additions in 2025 and about 2,800 GW of cumulative capacity. It projected nearly 80% of renewable capacity additions through 2030 to come from solar (IEA 2025, 2026a). A static-loading forecast would produce enormous silver demand. It would also be methodologically wrong.
Technology pathways#
PERC dominated earlier mass production and established screen-printed silver contacts. Its share is declining.
TOPCon has grown rapidly and can require significant metallization, but fine-line printing, silver-coated copper and plated nickel/copper contacts reduce silver use.
Silicon heterojunction (SHJ) offers high efficiency but historically used substantial low-temperature silver paste. Fraunhofer’s 1.4 mg/W result used silver-copper paste on the front and copper on the rear, demonstrating a route far below conventional practice (Fraunhofer ISE 2025).
Back-contact cells shift contact geometry and can change metallization demand. They may improve efficiency and reduce balance-of-system cost, but silver intensity depends on process.
Perovskite-silicon tandems can raise efficiency and reduce module area per watt, yet their contact and encapsulation systems are still developing. They are not assigned a fixed silver intensity.
Copper plating is the most disruptive path. It can preserve conductivity with far less silver, but it requires process control, adhesion, contamination management, throughput, capex and long-term reliability. Laboratory success is not the same as bankable mass production.
Scenario calculations#
| Scenario | Year | Annual PV installations (GW) | Silver loading (mg/W) | Gross PV silver demand (Moz) | Potential recovered PV silver (Moz) | Illustrative directional pressure (Moz; zero floor) |
|---|---|---|---|---|---|---|
| Base case | 2030 | 900 | 5 | 144.7 | 1 | 143.7 |
| Base case | 2035 | 1200 | 3.5 | 135 | 5 | 130 |
| Base case | 2040 | 1500 | 2.5 | 120.6 | 12 | 108.6 |
| Base case | 2045 | 1800 | 1.8 | 104.2 | 25 | 79.2 |
| Base case | 2051 | 2100 | 1.2 | 81 | 40 | 41 |
| Industrial demand acceleration | 2030 | 1050 | 7 | 236.3 | 1 | 235.3 |
| Industrial demand acceleration | 2035 | 1500 | 5 | 241.1 | 5 | 236.1 |
| Industrial demand acceleration | 2040 | 2100 | 3.5 | 236.3 | 14 | 222.3 |
| Industrial demand acceleration | 2045 | 2600 | 2.5 | 209 | 30 | 179 |
| Industrial demand acceleration | 2051 | 3200 | 1.8 | 185.2 | 50 | 135.2 |
| Substitution and efficiency | 2030 | 900 | 2.2 | 63.7 | 1 | 62.7 |
| Substitution and efficiency | 2035 | 1200 | 1.2 | 46.3 | 5 | 41.3 |
| Substitution and efficiency | 2040 | 1500 | 0.7 | 33.8 | 12 | 21.8 |
| Substitution and efficiency | 2045 | 1750 | 0.5 | 28.1 | 20 | 8.1 |
| Substitution and efficiency | 2051 | 2000 | 0.35 | 22.5 | 28 | 0 |
| Monetary and supply shock | 2030 | 800 | 5 | 128.6 | 1 | 127.6 |
| Monetary and supply shock | 2035 | 1000 | 3.5 | 112.5 | 5 | 107.5 |
| Monetary and supply shock | 2040 | 1200 | 2.5 | 96.5 | 12 | 84.5 |
| Monetary and supply shock | 2045 | 1400 | 1.8 | 81 | 24 | 57 |
| Monetary and supply shock | 2051 | 1600 | 1.2 | 61.7 | 35 | 26.7 |
The base case reaches 2,100 GW of annual additions in 2051 but only 81 Moz of gross silver demand because loading falls to 1.2 mg/W. It is possible for the solar industry to more than triple annual deployment while using less silver than in 2026.
The industrial-acceleration case assumes 3,200 GW and 1.8 mg/W, creating 185 Moz. The substitution case assumes 2,000 GW and 0.35 mg/W, only 22.5 Moz. That 162.7 Moz difference is larger than many mine-development forecasts. It is why solar metallization is the model’s most important technical sensitivity.
Potential recovered PV silver is shown separately. The final column is a zero-floor directional comparison of gross PV use with the potential secondary stream; it is not a physical market balance and does not assume immediate closed-loop return to new panels. In the 2051 substitution case, zero means illustrative potential recovery is at least as large as gross PV use. It does not claim negative demand or immediately available excess silver: scrap timing, collection, refining and ownership still matter.
What would confirm the high-demand solar case?#
- commercial loading remains above 5 mg/W into the 2030s;
- copper processes suffer reliability or yield failures;
- policy and economics push global additions above the IEA pathway;
- module life shortens without proportional recovery;
- China and other manufacturing centers prioritize rapid capacity over material efficiency;
- silver prices fall enough to reduce the incentive to substitute.
What would confirm the substitution case?#
- bankable mass production below 2 mg/W;
- major manufacturers publish low-silver or silver-free roadmaps with warranty data;
- plating equipment achieves competitive throughput and yield;
- silver paste share falls across TOPCon, SHJ and tandem lines;
- PV demand falls below 100 Moz despite rising installations.
Investment demand and inventories#
Physical investment#
Physical investment is the most regime-sensitive fabrication category. It rises with currency distrust, financial stress, inflation fear, social-media speculation and concern about counterparties. It falls when investors take profits, real yields rise, household cash flow deteriorates or alternative assets offer better returns.
One-ounce sovereign coins are recognizable but expensive to fabricate. Private rounds and small bars usually have lower premiums. Kilo and 100-ounce bars reduce fabrication cost per ounce but narrow the retail buyer pool. Large wholesale bars are efficient but require professional storage and testing.
The model uses coin and net bar demand of 220–260 Moz in the base case, 250–350 Moz in the industrial case, 160–190 Moz in the substitution case and 450–700 Moz in the shock case. These are net flows. Gross retail turnover can be much larger because dealers resell existing products.
Collectible coins are not interchangeable with bullion. A rare coin can rise while silver falls, or lose collector premium while silver rises. Numismatic demand depends on rarity, grade, provenance, population reports, demographics and fashion. It should never be included in a metal-price forecast without separating melt value.
Institutional investment#
Institutional exposure includes ETPs, closed-end trusts, futures, options, swaps, commodity indexes, managed funds and structured products. These instruments can influence marginal price even when no retail product is minted.
An ETP creation can require the acquisition of bars by an authorized participant; a redemption can release metal. A futures purchase does not necessarily require immediate physical delivery, but it changes risk transfer, curve structure and arbitrage. Options can force dealer hedging as prices move. Managed-money positioning can amplify trends.
SLV held about 491.75 Moz on August 21, 2026, charged a 0.50% sponsor fee and showed a median bid–ask spread of 0.02% (BlackRock 2026). That is an example of liquid exposure with low transaction friction relative to coins, but the investor owns a security under the trust structure, not a personally selected bar available for ordinary small-holder redemption.
Inventory categories#
The following categories must remain separate:
- exchange registered;
- exchange eligible;
- London and other commercial vault holdings;
- ETP metal;
- government and institutional holdings;
- mint and dealer stocks;
- privately held bars and coins;
- jewelry and silverware;
- industrial products in use;
- manufacturing scrap;
- end-of-life recoverable products;
- dispersed uneconomic silver;
- cultural and heirloom objects;
- unreported private stock.
Theoretical stock is the silver still existing above ground. Economically recoverable stock is the part worth collecting and processing. Immediately deliverable stock is the part in the right form, location, title and warehouse category. These quantities are not substitutes.
The Silver Market Stress Ladder#
Level 1 — Normal liquidity. Wholesale spreads, lease rates and delivery function normally. Retail premiums reflect fabrication.
Level 2 — Elevated retail demand. Dealer stocks fall and popular products command higher premiums, but wholesale bars remain available.
Level 3 — Mint-product shortage. Blanks, mint capacity, packaging or distribution constrain coins. Generic bars may remain available.
Level 4 — Wholesale-bar tightness. Large-bar premiums, lease rates and location spreads rise; refiners and fabricators report difficulty.
Level 5 — Exchange inventory stress. Registered stocks decline with heavy delivery demand, backwardation or unusual warrant behavior.
Level 6 — Transport/refining disruption. Metal exists but cannot move or change form because routes, refineries or accreditation fail.
Level 7 — Settlement or currency crisis. Confidence in contracts or currency is impaired and physical ownership is valued independently of ordinary market price.
A claim that the market is at Level 5 or above should show multiple indicators. A high American Silver Eagle premium alone establishes at most Level 2 or Level 3.
Buying silver#
| Method | Ownership | Liquidity | Typical costs | Main risks | Best suited for |
|---|---|---|---|---|---|
| Local coin shop | Direct title to product | Same day | Premium, tax, spread | Counterfeit/selection risk | Small buyers, immediate possession |
| Online bullion dealer | Direct after delivery | Days | Premium, payment, shipping, insurance | Counterparty and delivery risk | Price comparison and selection |
| Government mint | Direct product title | Variable | Often high premium, shipping | Limited stock, collector pricing | Recognized sovereign products |
| Peer-to-peer | Direct | Variable | Platform/escrow cost | Fraud, safety, authenticity | Experienced buyers |
| Allocated vault | Specific or pooled allocated title | High if redemption market works | Storage, insurance, withdrawal | Custody and legal-title risk | Large holdings and efficient resale |
| Unallocated account | Contractual claim | High | Spread, account fees | Issuer credit and allocation risk | Trading, not necessarily possession |
| Exchange-traded trust | Security interest, not personal bar title | Very high | Fee, spread, brokerage, tax | Tracking, custody, structure | Liquid portfolio exposure |
| Futures/options | Derivative exposure | Very high before expiry | Margin, roll, commissions | Leverage, basis, forced liquidation | Hedgers and sophisticated traders |
| Tokenized vaulted silver | Depends on contract | Potentially 24/7 | Custody, redemption, network fees | Legal title, bankruptcy, cyber/oracle risk | Fractional transfer where well governed |
How to compare buying methods#
A buyer should identify the desired exposure before comparing products.
- Possession objective: direct physical control, accepting storage and transaction friction.
- Liquidity objective: close tracking of market price with rapid trading.
- Hedge objective: offset a business or portfolio risk.
- Collecting objective: rarity, design, provenance and condition.
- Payment or collateral objective: transferability and legal recognition.
- Industrial objective: assured specification, quantity and delivery schedule.
A low-premium bar is not automatically better than a sovereign coin. The bar stores efficiently and tracks metal more closely; the coin may be easier to authenticate and sell in small units. An ETP may minimize spread and storage administration; it does not provide ordinary possession. Futures may be the cheapest exposure for a professional hedger and the most dangerous for an inexperienced leveraged buyer.
Legal title and custody#
“Allocated” generally means specific metal or a defined share of an allocated pool is held for the customer and separated according to the contract. “Unallocated” usually means the customer has a contractual claim on the provider rather than title to identified bars. Exact legal treatment varies by jurisdiction and document.
A vault buyer should ask:
- Is title direct, beneficial or merely contractual?
- Are bars individually identified?
- Can the provider lend, pledge or rehypothecate them?
- Who is the custodian and subcustodian?
- Are holdings independently reconciled to a bar list?
- What insurance exclusions apply?
- What happens if the dealer, vault or platform becomes insolvent?
- Can the customer redeem, in what minimum size, at what fee and in what location?
- Can redemption be suspended?
The phrase “fully backed” is not enough. Backing can be pooled, encumbered, held by an affiliate or inaccessible to small holders.
Cost stack#
The buyer’s final cost is:
spot or wholesale value
- fabrication
- mint or brand premium
- wholesale distribution
- dealer margin
- payment cost
- tax
- shipping
- insurance
= delivered acquisition cost
For a 1 oz coin, fixed handling and packaging are large relative to metal value. For a 100 oz bar, those costs are spread over more ounces. During volatile markets, dealers also price inventory risk: they may widen offers because replacement cost is uncertain.
Cash, bank transfer and card prices differ because payment fraud and processing fees differ. “Free shipping” is normally embedded in the quoted premium. Comparing only the headline premium can therefore mislead.
Future buying experience#
By 2051, common features are likely to include real-time product-specific bids and asks, automated identity verification, serial-number databases, computer-vision screening, integrated insured logistics and comparison engines that show delivered cost rather than spot premium alone. Vaulted products may support fractional transfer and rapid settlement.
The main constraint will not be technology. It will be trust. The strongest providers will show legal terms, audited inventory, insurance, pricing methodology, complaint handling, correction records and a clear path from digital account to physical redemption.
Selling silver#
| Selling channel | Best suited for | Speed | Price potential | Verification required | Main costs | Main risks |
|---|---|---|---|---|---|---|
| Local coin dealer | Recognized coins/bars | Minutes to days | Medium | Weight, dimensions, tests | Dealer spread | Low quote if dealer overstocked |
| Online dealer buyback | Standard bullion, larger lots | Days to weeks | Medium–high | Declared product, inspection | Shipping/insurance | Transit and repricing risk |
| Refiner | Large scrap or bars | Weeks | High for suitable lots | Assay | Assay/refining/minimums | Settlement delay, deductions |
| Auction house | Rare/numismatic objects | Weeks to months | Potentially highest | Attribution, grade, provenance | Seller commission | Reserve failure, long timeline |
| Peer-to-peer marketplace | Popular bullion | Variable | Potentially high | Strong authentication needed | Platform/escrow/shipping | Fraud and personal safety |
| Pawnshop | Urgent mixed material | Same day | Usually low | Basic tests | Large spread | Convenience priced heavily |
| Jewelry buyer | Wearable/designer silver | Same day to weeks | Medium | Hallmarks, workmanship | Margin/commission | Melt-only valuation |
| Industrial recycler | E-scrap, PV, process residues | Weeks | High for documented feed | Sampling/assay | Treatment/logistics | Complex terms, rejected material |
| Broker/exchange sale | ETP, futures or token | Seconds to days | Transparent market price | Account/KYC | Spread, fee, tax | Platform/counterparty risk |
Net proceeds, not advertised price#
The highest advertised percentage of spot is not necessarily the best sale. Net proceeds are:
market value
− product discount or dealer margin
− testing and assay
− refining and treatment
− shipping and insurance
− platform or auction commission
− payment and currency charges
− tax
= seller’s net proceeds
A refiner may quote 98% of contained silver but charge assay, minimum lot and treatment fees. A dealer may quote 96% with immediate payment and no shipping. The second offer can be better for a small lot.
Bullion coins and bars#
Recognized sovereign coins usually need weight, dimension, visual and electromagnetic checks. A dealer with strong retail demand may pay near or above spot for popular products. The same dealer may discount an obscure round because resale is slower.
Bars concentrate value and reduce handling. Large bars may require ultrasound or professional assay, especially when the chain of custody is unclear. Original packaging is evidence, not proof; counterfeit packaging and tampered assay cards exist.
The seller should obtain product-specific bids, not ask only “what do you pay for silver?” Quotes should state the reference price, time, lock procedure, inspection terms, payment timing and right to reject.
Sterling silver, jewelry and flatware#
The melt value formula is:
gross weight in grams × silver purity × spot price per troy ounce ÷ 31.1034768
Sterling is normally 92.5% silver, but marks can be false and solder or weighted components reduce recoverable silver. Knives may have silver handles filled with nonmetal material. Jewelry may contain stones that are excluded from weight. Refiners pay on recoverable content, not gross scale weight.
Designer, antique, religious or artist-made objects can be worth much more than melt. A household seller should check hallmarks, maker, age, pattern and comparable auction results before sending objects to a scrap buyer. Conversely, sentimental value does not guarantee a market premium.
Illustrative scrap payouts can range widely—from roughly 70% of melt for inconvenient, mixed or small lots to above 90% for clean, documented, competitive material. This paper does not claim an audited universal average. Geography, lot size, assay, fraud risk and refinery terms dominate.
Industrial and electronic scrap#
Industrial sellers should compare settlement formulas rather than headline percentages. Key terms include sampling method, moisture, payable percentage, treatment charge, refining charge, penalties, provisional payment, final settlement, minimum lot and dispute procedure.
For e-scrap and PV, silver may be one of several payable metals. The optimal processor is the one that maximizes total recoverable value net of logistics and compliance, not necessarily the one with the highest silver percentage.
The 2051 seller#
The likely 2051 workflow is:
- photograph or scan the item;
- receive a provisional quote from multiple buyers;
- verify identity and legal ownership;
- use a calibrated home or partner test where appropriate;
- schedule insured pickup or secure drop-off;
- complete machine-assisted XRF, electromagnetic, ultrasound or vision checks;
- receive a final product-specific bid;
- transfer title and settle through bank, regulated token or another approved rail;
- retain a digital assay and tax record.
Remote authentication will reduce friction but not eliminate physical inspection. A photograph cannot reveal every plated bar or internal core.
Dealers, premiums and spreads#
How dealers make money#
A bullion dealer is a market maker, inventory manager, authenticator, logistician and sometimes a lender. Revenue can come from:
- retail premiums and bid–ask spreads;
- wholesale inventory turns;
- hedging and basis management;
- shipping and insurance;
- storage and custody;
- grading and authentication;
- consignment and auction services;
- financing;
- numismatic expertise;
- refining relationships.
A rising silver price does not guarantee dealer profit. An unhedged dealer may make mark-to-market gains on inventory and then lose them during a reversal. A hedged dealer can earn spread while neutralizing much of the price move. Volatility can increase revenue and risk simultaneously.
Inventory financing and hedging#
Dealers often finance inventory with credit. Higher interest rates raise the cost of carrying metal, encouraging smaller inventories and wider spreads. Futures, forwards and ETPs can hedge price exposure, but basis risk remains: a dealer may hold Silver Eagles whose premium moves independently of COMEX.
When retail demand surges, product premiums can rise even if wholesale silver is calm. A mint cannot instantly add presses, dies, blanks and shifts. When retail selling surges, dealers may discount generic products because they have too much inventory, even as quoted spot remains high.
Illustrative premium environments#
No public source provides a complete, transaction-weighted world average of retail premiums and buyback spreads for August 2026. The following are model ranges, not observed universal facts:
| Environment | Generic rounds/small bars | Sovereign coins | Large bars | Dealer buyback behavior |
|---|---|---|---|---|
| Calm, well supplied | 4%–10% over spot | 8%–20% | 2%–6% | Near spot to several percent below, product dependent |
| Elevated retail demand | 8%–20% | 15%–40% | 3%–10% | Strong bids for recognized products |
| Mint bottleneck | 5%–15% | 25%–60%+ | 2%–8% | Premium retained only for products buyers want |
| Wholesale tightness | 10%–25% | 20%–60%+ | 8%–20% | High nominal bids, but volatility locks and delays |
| Liquidation | 0%–6% | 3%–15% | 0%–4% | Wider discounts, selective inventory |
A “premium” is not guaranteed to survive resale. The buyer may pay 25% over spot for a scarce coin and later receive only spot when mint supply normalizes. Product premium is a separate risk position.
Automated pricing and consolidation#
Dealer quotes will increasingly combine live metal price, product recognition, local demand, inventory age, hedge cost, shipping and fraud score. This should improve transparency for standard products. It may worsen outcomes for sellers whose items are misclassified by automation.
Large platforms can consolidate because technology, compliance, insurance and fulfillment have economies of scale. Local dealers retain advantages in trust, cash flow, immediate inspection and regional knowledge. The likely market is hybrid: national pricing and logistics networks with local authentication and service nodes.
Product-specific outlook#
| Product | Typical premium | Storage efficiency | Authentication | Resale liquidity | 2051 assessment |
|---|---|---|---|---|---|
| Sovereign 1 oz coin | High | Low | Strong visual/security features | Very high | Best recognition; premium can be hard to recover |
| Private round | Low–medium | Low | Brand and testing matter | High | Efficient small-unit bullion |
| 1–10 oz bar | Medium | Medium | Packaging, serial, dimensions | High | Convenient but fabrication costs matter |
| Kilo/100 oz bar | Low | High | Assay or trusted brand | High with dealers/refiners | Storage efficient; fewer retail buyers |
| Good Delivery bar | Very low | Very high | Professional chain of integrity | Wholesale | Institutional product, not typical retail |
| Junk/circulating silver | Variable | Low | Date/type familiarity | Regional | Finite supply and useful fractional units |
| Numismatic silver | Collector-driven | Low | Grade/provenance expertise | Variable | Metal forecast is secondary to collector market |
| Sterling silver | Often below bullion economics | Low | Hallmark/XRF/assay | Medium | Workmanship can exceed melt; scrap payout varies |
| Industrial scrap | Treatment-dependent | High in bulk | Sampling/assay | Specialist | Concentration and lot size determine value |
Sovereign bullion coins#
American Silver Eagles, Canadian Maple Leafs, British Britannias, Austrian Philharmonics, Australian Kangaroos and Mexican Libertads combine legal-tender status, mint identity and international recognition. Their value is mostly metal plus product premium, unless a specific date or finish is collectible.
Security features should improve. The Royal Mint uses a latent padlock/trident image, microtext, tincture lines and animated surface details on Britannias. The U.S. Mint introduced a variation in the reeded edge of Silver Eagles. Such features raise counterfeit difficulty but do not make inspection infallible (Royal Mint 2026; U.S. Mint 2026).
Premiums depend on mint policy and capacity as much as metal. The Silver Eagle can command a high U.S. premium because of brand and distribution rules. Libertads can carry scarcity and collector premiums. A 2051 buyer should compare total cost and likely buyback, not reputation alone.
Private-mint rounds#
Rounds usually offer lower premiums and broad design choice. Resale depends on refiner or mint reputation. A generic round may be accepted by most dealers after testing but receive less than a sovereign coin during selective markets.
Serialized products, tamper evidence and digital certificates will become common. The certificate is only as reliable as the issuer and database.
Small bars#
One-, five- and ten-ounce bars are convenient but have more fabrication cost per ounce than larger bars. Assay packaging can simplify recognition but can also hide tampering or discourage testing. Future products are likely to combine serials, microfeatures, machine-readable surfaces and public verification.
Kilo, 100-ounce and wholesale bars#
Large bars minimize premium and storage volume. They are better suited to vaults, dealers and long-horizon buyers. Their disadvantages are indivisibility, higher absolute fraud loss, shipping weight and a smaller retail market.
Good Delivery bars are professional-market instruments governed by specifications and a chain of integrity. A retail buyer should not assume that owning one makes liquidation effortless in every jurisdiction; vault location, title and refiner status still matter.
Junk silver and circulating coinage#
Former circulating silver coins offer recognizable fractional units and finite supply. Their actual silver content depends on denomination, national standard and wear. During retail stress, they may attract premiums. Over decades, sorting knowledge may decline, increasing reliance on databases and machine recognition.
They are not immune to counterfeiting, clipping, alteration or legal restrictions. Collectible dates should be separated before sale as scrap.
Numismatic silver#
Numismatic returns depend more on collector markets than silver. Population reports can improve transparency but also concentrate demand in graded holders. Digital provenance can reduce some fraud while creating dependence on databases.
Demographic change is a two-sided risk. Aging collectors may release supply; global online access may expand the buyer pool. The 2051 collector market will probably be more international and data-rich, but not necessarily more liquid for ordinary material.
Sterling and designer silver#
Sterling objects occupy three value layers:
- contained silver;
- workmanship and brand;
- historical, artistic or cultural value.
A mass-produced damaged spoon may trade near melt. A complete named pattern or artist-made object can sell at a multiple of melt. Automated image recognition may help identify makers, but expert attribution remains important.
Industrial scrap#
Industrial lots are valued through contained and payable metal, not retail premium. The future advantage will go to sellers who preserve traceability, segregate waste, document process chemistry and contract directly with specialized refiners.
Tokenized and digital silver#
A tokenized product can represent very different legal relationships:
- direct ownership of an identified bar or fraction;
- beneficial ownership in an allocated pool;
- a warehouse receipt;
- an unsecured claim on an issuer;
- a security entitlement held through a custodian;
- synthetic exposure based on a price oracle.
The SEC’s 2026 discussion of tokenized securities is useful by analogy: a token may or may not convey the same rights as the underlying asset, and third-party tokenization can introduce bankruptcy risk absent from direct ownership. The BIS likewise emphasizes that tokenization changes transfer infrastructure, not the legal nature of the claim, and requires governance, resilience and interoperability (SEC 2026; BIS 2026).
Due-diligence checklist for silver-backed digital products#
- Identify the legal issuer and governing law.
- Determine whether ownership is allocated, unallocated or synthetic.
- Obtain the custody agreement and bar-list policy.
- Check whether the metal can be pledged or lent.
- Review independent audit and reconciliation frequency.
- Verify insurance, exclusions and beneficiary.
- Read bankruptcy and segregation provisions.
- Confirm redemption size, location, fees and suspension rights.
- Identify price oracle, market source and outage procedure.
- Review smart-contract audit, upgrade keys and administrator powers.
- Assess blockchain congestion, bridge and wallet risks.
- Check KYC, sanctions and transfer restrictions.
- Compare secondary-market liquidity with direct redemption value.
- Understand tax treatment in the holder’s jurisdiction.
- Test whether the token trades at a persistent premium or discount to metal.
Tokenization is likely to reduce minimum purchase size and settlement time. It may create global dealer bidding and collateral use. It will not eliminate custody or regulation. The strongest products will make redemption routine; weak products will use “backed by silver” as marketing while making physical access impractical.
Authentication and counterfeiting#
Counterfeit risk rises with price and online commerce. Common threats include plated bars, base-metal cores, false hallmarks, altered coins, counterfeit mint products, tampered packaging, fake certificates, false assay reports, stolen identities and synthetic product images.
No single test is sufficient.
Weight and dimensions catch many fakes but not a correctly engineered alloy or hollow object.
Magnetic and electromagnetic tests are useful because silver’s response differs from many base metals. Geometry and calibration matter.
Electrical conductivity can screen known products but surface condition and alloy can affect readings.
XRF provides rapid, nondestructive surface composition and can detect plating or incorrect alloy. It may not reveal a deep core if the surface layer is thick. Evident demonstrates XRF’s ability to identify plating and incorrect silver fineness in jewelry, but it is a vendor source and should not be treated as proof of every device’s capability (Evident 2026).
Ultrasound can detect internal discontinuities and cores in bars. It requires correct reference velocity, surface coupling and operator skill.
Visual and security-feature inspection is powerful for known coins. It fails when the observer lacks a genuine reference or when a counterfeit is sophisticated.
Destructive assay or fire assay offers high confidence for appropriate material but damages the item and may be uneconomic for retail products.
A sensible protocol is layered: provenance, visual examination, weight/dimensions, electromagnetic response, then XRF or ultrasound when value or uncertainty warrants. Dealers should disclose which tests they performed and their limitations.
AI will help recognize dies, surfaces, serials and packaging. It will also create convincing fake listings, documents and customer identities. Marketplaces will need verified capture, liveness checks and chain-of-custody controls rather than trusting uploaded images.
Taxation, regulation and regional markets#
Tax rules can change the effective silver price by more than a dealer spread. They must be checked by date, product and jurisdiction.
United States. The IRS states that net long-term gains on collectibles such as coins can be taxed at a maximum 28% federal rate; short-term gains are ordinary income. State sales-tax treatment varies. Reporting, retirement-account custody and business rules are separate questions (IRS 2026).
Canada. CRA guidance distinguishes qualifying precious metals from lower-purity or nonqualifying forms. Silver generally must be at least 99.9% pure and in bar, ingot, coin or wafer form to enter the precious-metal financial-instrument treatment. Sterling jewelry is generally taxable property rather than qualifying investment metal (CRA 2026).
Singapore. Qualifying investment precious metals are GST-exempt. Silver bars generally need at least 99.9% purity, international bullion-market tradability, accepted quality marks and nondecorative form; qualifying coins must meet prescribed conditions. Decorative and numismatic products may remain taxable (IRAS 2026).
United Kingdom and European Union. Investment gold has a specific tax framework that should not be assumed to apply to silver. Silver VAT treatment depends on jurisdiction, product, margin scheme, import and storage structure. Dealers and buyers must use current national guidance.
India. Import duties, GST, hallmarking and local market structure strongly affect prices. India’s jewelry, silverware and investment demand can change rapidly with income, festivals, agricultural conditions and policy.
China. Industrial policy, exchange activity, imports, exports, solar manufacturing and capital controls shape the market. Domestic prices can diverge from London after currency and tax.
Hong Kong and the UAE. Their roles as trading, logistics and refining hubs depend on customs, sanctions compliance, vault infrastructure and regional wealth.
Australia, Japan and Latin America. Australia combines mine supply and a mature bullion market. Japan has sophisticated industrial demand and tax rules. Latin America is more important to mine supply than retail investment at the global level, but local currency stress can stimulate physical demand.
Across markets, AML and KYC obligations will expand for dealers, vaults and digital platforms. Cash limits, source-of-funds checks, sanctions screening and transaction reporting can reduce privacy. Environmental regulation will increase mine and recycling costs while potentially improving traceability and secondary supply.
This study is not tax or legal advice. Regional treatment can change, so check the applicable official guidance and a qualified adviser before a transaction or filing.
Silver versus gold and other assets#
Silver and gold share monetary and jewelry histories but have different market structures.
Gold has a larger, more liquid market, much greater central-bank demand and a smaller industrial share. Silver has more cyclical industrial exposure, lower value density, higher storage cost per dollar and often higher retail premiums. These features make silver more volatile.
The gold-to-silver ratio is useful as a relative-valuation indicator, not a physical law. It can move because gold rises, silver falls or both move at different rates. A historical 15:1 ratio does not determine the future; modern mine supply, central-bank demand, industrial use and financial market depth differ from ancient monetary systems.
“Gold on steroids” is an imprecise slogan. Silver can outperform gold during precious-metal bull markets because its market is smaller and investment flows have greater marginal impact. It can underperform during industrial recessions, high real rates or forced liquidation. The proposition is conditional, not a defining property.
Compared with equities and real estate, silver produces no cash flow. Its return depends on resale price minus costs. Compared with bonds and cash, it has no contractual income or principal. Compared with broad commodities, it is easier for individuals to own physically but has high small-lot friction. Compared with cryptocurrency, physical silver has no network or protocol risk but has storage, verification and transport risk.
Silver can diversify some portfolios, but it is not a guaranteed inflation hedge. Inflation accompanied by high real rates and a strong dollar can be unfavorable. A holder who bought during a mania can wait decades for a real recovery.
The 25-year buyer and seller journey#
| Case | Holding period (years) | Initial acquisition cost ($/oz) | Cumulative physical storage ($/oz) | Sale realization (% of spot) | Break-even future spot ($/oz) | Spot increase needed (%) |
|---|---|---|---|---|---|---|
| Physical sovereign coin | 5 | 79.94 | 2.4 | 98 | 84.01 | 20.9 |
| Low-premium large bar | 5 | 72.29 | 1.45 | 99 | 74.48 | 7.2 |
| Exchange-traded trust (0.50% fee) | 5 | 69.52 | Embedded in annual fee | 99.99 | 71.29 | 2.6 |
| Physical sovereign coin | 10 | 79.94 | 4.8 | 98 | 86.46 | 24.4 |
| Low-premium large bar | 10 | 72.29 | 2.89 | 99 | 75.94 | 9.3 |
| Exchange-traded trust (0.50% fee) | 10 | 69.52 | Embedded in annual fee | 99.99 | 73.1 | 5.2 |
| Physical sovereign coin | 25 | 79.94 | 11.99 | 98 | 93.8 | 34.9 |
| Low-premium large bar | 25 | 72.29 | 7.23 | 99 | 80.32 | 15.6 |
| Exchange-traded trust (0.50% fee) | 25 | 69.52 | Embedded in annual fee | 99.99 | 78.81 | 13.4 |
These examples use the $69.51 benchmark baseline and exclude taxes.
Buyer A — Sovereign coin. Purchase at 15% over spot, store at 0.6% of initial value per year and sell at 98% of future spot. The five-year break-even spot is about $84, a 21% increase. At 25 years, the hurdle is nearly $94 before inflation. If the coin’s premium is retained at resale, the outcome improves; if the product falls out of favor, it worsens.
Buyer B — Large bar. Purchase at 4% over spot, store at 0.4% a year and sell at 99% of spot. Five-year break-even is about $74.50. The lower fabrication premium materially improves economics, but a large bar is less divisible and may require stronger authentication.
Buyer C — Exchange-traded trust. Purchase near NAV with a 0.02% spread and pay a 0.50% annual sponsor fee. Five-year break-even is about $71.30, but the drag compounds to a roughly 13% spot increase over 25 years. Brokerage, tax, tracking and structure can change the result.
Buyer D — Collector. No universal break-even can be modeled. A coin’s metal value may be a small fraction of its price. Grade, rarity and future collector demand dominate.
Seller E — Household silver. A sterling flatware owner’s gross melt value is reduced by purity, filled pieces, solder, assay and buyer margin. A pattern or maker premium can reverse the conclusion. The correct first step is identification, not weighing alone.
The examples demonstrate that holding period does not erase friction. Storage and annual fees accumulate. Inflation also matters: a nominal break-even can still be a real loss.
Original analytical frameworks#
Framework 1 — Silver Availability Ladder#
The ladder distinguishes geology, resources, reserves, production, refined metal, deliverable inventory, dealer product, private holdings and recoverable scrap. Each transition has time, cost and legal conditions. It prevents the common error of treating a geological resource as immediate supply or a retail coin shortage as proof of crustal depletion.
Framework 2 — Silver Demand Elasticity Matrix#
| Application | Substitution difficulty | Thrifting potential | Price sensitivity | Recycling potential | 2051 outlook |
|---|---|---|---|---|---|
| PV metallization | High after redesign | Very high | High | Medium–high | Likely lower silver intensity; total demand depends on deployment |
| Electrical contacts/switches | Medium | Medium | Low–medium | Medium | Steady growth; silver retained in high-reliability uses |
| Power electronics/grid | Medium | Medium | Low–medium | Medium | Positive but smaller than broad electrification rhetoric suggests |
| Automotive electronics | Medium | Medium | Medium | High | Growth with EVs, offset by architecture changes and thrifting |
| Medical/antimicrobial | Medium | Medium | Low in critical uses | Medium | High-value niche, not a bulk-market driver |
| Brazing and solders | Medium | Medium | Medium | High | Cyclical industrial growth |
| Jewelry | High | Medium | High | High | Income growth versus price elasticity |
| Silverware | High | Medium | High | Very high | Flat to modest growth; large recycling response at high prices |
| Photography | Medium | Low | Medium | Very high | Long decline toward a specialist floor |
| Coins and bars | No material substitute | Low | Very high | Very high | Cyclical and regime-dependent |
The matrix shows why a high price does not reduce every use equally. A low-mass contact in a safety-critical breaker can tolerate expensive silver. A solar paste used at enormous scale attracts aggressive redesign. Jewelry can become lighter; investment demand can rise when price rises, temporarily creating positive rather than negative elasticity.
Framework 3 — Retail Silver Transaction Waterfall#
The buyer moves from wholesale metal through fabrication, minting, distribution, payment, tax and delivery. The seller moves backward through verification, inventory risk, refining and dealer margin. The spread between the two waterfalls is the hurdle the metal price must overcome.
For website implementation, a calculator should display every layer separately and let users replace the assumptions. A single “premium” input hides too much.
Framework 4 — Silver Market Stress Ladder#
The seven levels distinguish retail demand, mint constraints, wholesale-bar tightness, exchange stress, logistics failure and settlement crisis. Each level requires stronger evidence. It provides a disciplined alternative to calling every premium spike a shortage.
Framework 5 — The 2051 Silver Seller#
The 2051 seller is likely to receive competitive global bids, use automated product recognition and schedule insured collection. Yet physical settlement remains local. A buyer must still accept the bar, coin or scrap lot under a governing law. Technology makes the market faster; it does not eliminate assay, custody or jurisdiction.
Claims requiring special scrutiny#
| Claim | Available evidence | Counterevidence | Conclusion | Confidence |
|---|---|---|---|---|
| “Silver will run out.” | Annual deficits and rising industrial use | Large stocks exist in many forms; price, recycling, substitution and mine investment respond | False as a literal claim. Local or product shortages can occur. | High |
| “Solar will consume all silver.” | PV is a major industrial user and deployment is rapid | Loading per watt is falling; copper and plating routes exist | Possible only under implausibly static technology assumptions. | High |
| “COMEX has almost no silver.” | Registered inventory can fall sharply | Eligible metal, London stocks, ETP metal and off-exchange stocks are separate pools | Requires dated category-specific evidence; broad statement is misleading. | High |
| “The paper market is hundreds of times physical.” | Gross derivatives notionals can be large | Turnover, netting, maturity and hedging make gross ratios incomparable | No single paper-to-physical ratio proves insolvency or manipulation. | High |
| “The ratio must return to 15:1.” | Historical episodes had low ratios | Modern market sizes, uses and monetary roles differ | A scenario input at most, never a law. | High |
| “Silver always rises with inflation.” | Some inflationary regimes were bullish | High real rates, strong dollar or recession can dominate | Inflation is conditional, not sufficient. | High |
| “Every EV contains a fixed silver amount.” | EVs usually contain more electronics | Architecture and vehicle class vary; thrifting changes content | Use ranges and fleet mix, not one constant. | High |
| “AI will create enormous silver demand.” | Data centers need electrical equipment | Direct silver intensity is poorly quantified and often double-counted | Treat as an indirect supportive factor, not a standalone demand block. | Medium-high |
| “Deficits guarantee price increases.” | Deficits can tighten inventories | Disinvestment, inventory release, substitution and weak macro can bridge deficits | Persistent deficits raise risk but do not set timing or price. | High |
| “Physical premiums prove wholesale exhaustion.” | Premium spikes reveal retail stress | Mint, blank, logistics or product bottlenecks can exist with wholesale metal available | Confirm with wholesale bars, lease rates, inventories and delivery data. | High |
Indicators, invalidation and updates#
| Indicator | Bullish implication | Bearish implication | Primary source | Review frequency |
|---|---|---|---|---|
| PV silver loading (mg/W) | Slow decline supports demand | Fast decline/copper adoption weakens demand | Fraunhofer, manufacturers | Annual |
| Global PV additions | Deployment above path | Policy/grid bottlenecks | IEA, IRENA | Quarterly/annual |
| Mine project sanctions | Supply response lags | Large projects financed/permitted | Company filings | Quarterly |
| Base-metal mine output | By-product constraint | Copper/zinc expansion adds silver | USGS/company reports | Quarterly/annual |
| Recycling supply | Limited response | Strong scrap response | WSS/refiners | Annual |
| ETP holdings | Persistent inflows | Disinvestment releases metal | Issuer disclosures | Daily/monthly |
| LBMA/COMEX inventories | Draws plus high lease rates | Rebuilding stocks | LBMA/CME | Daily/monthly |
| Real interest rates | Falling/negative | High and rising | Treasury/central banks | Daily/monthly |
| U.S. dollar | Weakening | Strengthening | Federal Reserve H.10 | Weekly |
| Coin/bar premiums | Broad stress if wholesale confirms | Mint-only bottleneck | Dealers/mints/exchanges | Weekly |
| Lease rates and spreads | Persistent physical tightness | Normalization | LBMA/market data | Daily |
| Scrap payout and collection | Insufficient supply response | Large dishoarding wave | Refiners/dealers | Monthly |
Conditions that would invalidate the base case#
The base case should be revised materially if any of the following occurs:
- commercial PV silver loading falls below 1 mg/W before 2035 across most new capacity;
- world mine output exceeds 1.05 billion ounces for several years without severe cost inflation;
- recycling exceeds 400 Moz before 2035 through sustained collection and disinvestment;
- industrial fabrication falls below 550 Moz despite continued global electrification;
- ETP and physical investment remain structurally above 500 Moz a year outside crisis periods;
- London and exchange inventories rebuild while lease rates normalize despite reported deficits;
- real U.S. rates remain above 3% for a decade, or become deeply negative for a decade;
- a major monetary or settlement architecture changes the role of privately held bullion;
- widespread regulation materially restricts private bullion transfer or, conversely, makes tax-free digital bullion globally routine.
A forecast is not validated because price enters its range once. The model should be scored on annual average, supply, demand, technology and market structure together.
Update policy#
Daily or intraday: benchmark and futures price; major exchange inventory where reliable.
Monthly: ETP holdings, futures positioning, lease rates, dealer premiums, project announcements and visible disruptions.
Quarterly: mining-company production, costs, guidance, capex, project gates, macro assumptions and industrial indicators.
Annually: full supply-demand balance, USGS production and reserves, recycling, PV loading, scenario bands and error scorecard.
Every version should remain publicly archived. The scorecard should show prior forecast, actual result, variance, cause and model change. Silent revision destroys the learning value of a long-range study.
Frequently asked questions#
1. What is the 25-year outlook for silver?#
Silver is likely to remain both an industrial input and a financial asset. The central scenario has growing electrical demand, slow mine expansion, stronger recycling and falling silver use per solar watt. That combination supports a market that is often tight but still self-correcting. The 2051 base annual-average range is $93–$245 nominal, or $50–$132 in 2026 dollars. A substitution case is lower and a sustained monetary/supply shock much higher.
2. What could silver be worth in 2030?#
The base annual-average range is $55–$95 per troy ounce. Industrial acceleration raises the band to $76–$126; substitution and efficiency lower it to $40–$75; a monetary and supply shock produces $95–$220. These are scenario ranges, not price targets. A year-end price can sit outside the annual-average range.
3. What could silver be worth in 2050 or 2051?#
For 2051, the base range is $93–$245 nominal. The industrial-acceleration range is $245–$615, the substitution range $47–$114 and the shock range $349–$1,695. In constant 2026 dollars those ranges are far lower because inflation compounds. The extreme shock band requires persistent monetary and supply disruption, not ordinary business-cycle volatility.
4. Why can no one accurately predict silver 25 years ahead?#
The variables are endogenous. A higher price changes mine investment, recycling, product design, investor selling and substitution. Technologies not yet commercial can alter silver intensity. Regulation, war, inflation and currency systems can change. A precise 2051 number would hide those uncertainties. Scenarios are more useful because they explain which conditions produce each outcome.
5. Is silver facing a structural supply deficit?#
Industry estimates show repeated deficits through 2026, but “structural” should not mean permanent or unbridgeable. Deficits can be covered by inventories, ETP redemptions, private selling and statistical residuals. Persistent deficits signal pressure and increase the probability of price response, recycling and substitution. They do not prove that physical settlement must fail.
6. Will solar panels create a silver shortage?#
Solar can create tightness if installations grow rapidly while silver loading stays high. That is only one pathway. Manufacturers already have strong incentives to thrift silver and adopt copper-based contacts. The model’s 2051 PV demand ranges from about 22.5 Moz to 185 Moz depending mainly on loading per watt. Solar is a major driver, not a fixed claim on all future supply.
7. Can solar manufacturers replace silver with copper?#
They can replace much of it in several cell architectures, but adoption is not automatic. Copper processes must achieve high throughput, adhesion, reliability, low contamination, competitive capex and bankable warranties. Fraunhofer has demonstrated very low silver use and copper metallization routes. The commercial speed of that transition is the decisive uncertainty.
8. How much silver is used in electric vehicles?#
Published estimates often cite roughly 25–50 grams per battery electric vehicle, but the range varies with size, architecture, sensors and electronics. It will also change through thrifting. Applying one number to every vehicle and year is unreliable. The model includes automotive demand within broader electrical and industrial categories.
9. Will AI materially increase silver demand?#
AI supports data-center, semiconductor, networking and grid investment, all of which contain silver-bearing components. The direct silver intensity per data-center megawatt is not consistently reported. Claims of enormous AI-specific demand often double count broader electronics and grid categories. This study treats AI as an indirect industrial support, not a separate quantified block.
10. Can silver mine production expand?#
Yes, but slowly. Higher prices improve project economics and exploration, while copper growth can add by-product silver. Projects still need reserves, permits, finance, construction, community support and processing. Large resources do not become annual supply immediately. A meaningful response is more plausible over 10–25 years than over two or three.
11. Why does by-product mining matter?#
Most silver is associated with lead, zinc, copper or gold. A mine’s production decision may depend more on the host metal than silver. Copper expansion can add silver even at a modest silver price; a zinc closure can remove silver during a rally. Silver-only price models therefore miss a large part of supply behavior.
12. How much silver can be recycled?#
There is no fixed global maximum that is economically relevant. High-grade manufacturing scrap and investment metal can respond quickly. Jewelry and silverware depend on owner behavior. Electronics and PV require collection and concentration. The base model reaches 420 Moz by 2051; high-price scenarios reach 600–720 Moz, with wide uncertainty.
13. What happens to silver when interest rates rise?#
Higher real interest rates raise the opportunity cost of holding a non-yielding asset and often support the dollar, which can pressure silver. The effect can be offset by inflation fear, geopolitical stress or industrial demand. Nominal rates alone are insufficient; the relevant comparison includes expected inflation and financial risk.
14. Does silver protect against inflation?#
Sometimes, not reliably in every interval. Silver can rise in inflationary monetary stress, but it can fall when central banks raise real rates, the dollar strengthens or recession damages industry. Transaction costs also matter. It is better described as a volatile real asset with conditional inflation sensitivity than a guaranteed hedge.
15. Why is silver more volatile than gold?#
Silver’s market is smaller, industrial demand is more cyclical, retail premiums are higher and marginal investment flows can have a larger effect. Gold also benefits from central-bank demand and greater value density. Silver can outperform strongly in a precious-metals rally and fall harder in liquidation or industrial weakness.
16. Why do physical coins cost more than spot?#
Spot represents wholesale metal, not a finished retail product. Coins add fabrication, blanks, mint margin, distribution, dealer inventory, payment processing, tax, shipping and insurance. Product scarcity can add another premium. The premium can later disappear, so it is part of the investment cost and risk.
17. Why do dealers buy silver below spot?#
A dealer must test, finance, hedge, store and resell the product while accepting fraud and price risk. The discount compensates for those services and expected margin. Recognized products in strong demand may receive near-spot or above-spot bids; obscure, damaged or overstocked products may receive less.
18. Which silver products are easiest to resell?#
Widely recognized sovereign coins and bars from reputable refiners usually have the broadest dealer acceptance. Generic rounds can be liquid after testing. Large bars are efficient but suit fewer retail buyers. Numismatic, designer and antique objects require specialist markets. Local recognition and tax treatment can change the ranking.
19. Are large bars better than small coins?#
Large bars usually offer lower premiums and better storage efficiency. Small coins offer divisibility, recognizability and a larger retail buyer pool. The better choice depends on transaction size, custody, expected selling channel and need for physical access. A mixed holding can reduce the trade-off, but it adds product complexity.
20. Is sterling silver worth buying as an investment?#
Ordinary sterling bought near retail jewelry or antique prices is usually an inefficient bullion investment because workmanship and dealer margins dominate. Sterling bought below melt can be attractive, but authenticity, filled components and resale discounts matter. Designer or antique sterling is a collectible decision, not a pure metal trade.
21. Is tokenized silver safe?#
Safety depends on legal title, allocation, custody, audits, insurance, redemption and insolvency treatment. A blockchain record can be accurate while the issuer’s claim is weak or synthetic. Tokenization may improve transfer and fractional access, but it does not eliminate custodian, smart-contract, cyber, oracle or regulatory risk.
22. What is the difference between allocated and unallocated silver?#
Allocated silver is tied to identified metal or a defined allocated interest under the custody agreement. Unallocated silver is usually a claim on a provider for an amount of metal, making the holder a creditor under the contract. Labels vary, so legal documents and bankruptcy treatment matter more than marketing language.
23. What could make silver prices fall for many years?#
Rapid copper substitution, low PV loading, weak physical investment, high real rates, a strong dollar, mine expansion, heavy recycling and investor liquidation could combine. A high starting valuation also raises downside risk. The substitution scenario shows nominal prices can be stable while real purchasing power falls.
24. What could produce an extreme price increase?#
A sustained combination of currency distrust, negative real rates, mine disruption, sanctions, transport constraints, heavy physical investment, inventory drawdowns and slow substitution could create extreme prices. A brief panic can produce a spike; maintaining a high annual average requires persistent conditions and a limited supply response.
25. Will governments regulate silver ownership?#
Reporting, AML, KYC, cash limits, sanctions and tax rules are more likely to tighten than an outright universal ownership ban. Digital platforms and vaults are especially visible to regulators. Physical private transfers may remain possible but become less anonymous. Jurisdiction-specific rules should be monitored rather than assuming confiscation or immunity.
26. How should a seller compare dealer offers?#
Request a locked, product-specific bid and ask what benchmark, inspection, shipping, assay, fees and payment timing apply. Compare net proceeds after every deduction. For collectible or designer objects, obtain a specialist opinion before accepting melt value. Record weight, photographs, serials and chain of custody before shipping.
27. Will silver still be liquid in 2051?#
Probably, because it has deep industrial, jewelry and investment markets. Liquidity will differ by form. Standard bars, coins and regulated financial products should remain easiest. Obscure tokens, low-recognition rounds and mixed scrap may require discounts. Market liquidity does not guarantee an attractive price during stress.
28. How often should the forecast be updated?#
Prices and inventories can update daily, but the structural model should be reviewed quarterly and rebuilt annually. The most important annual updates are mine supply, recycling, PV loading, industrial demand, ETP holdings and macro assumptions. Earlier versions should remain visible so readers can evaluate forecasting error.
Glossary#
Allocated silver: Metal identified or segregated for a customer under a custody agreement, subject to the agreement’s legal terms.
Unallocated silver: A contractual claim for an amount of silver rather than ordinary title to identified bars.
Ask: The price at which a seller offers to sell.
Assay: A test or analytical process used to determine metal composition or purity.
Backwardation: A futures curve in which nearby prices exceed later prices; it can reflect tightness, financing or other market conditions.
Basis: The difference between a futures price and the relevant spot or cash price.
Bid: The price a buyer offers.
Bullion: Precious metal valued primarily for its metal content rather than rarity or artistry.
By-product production: Silver recovered from mining primarily undertaken for another metal.
COMEX: A CME Group futures market used for silver hedging, price discovery and delivery under exchange rules.
Contango: A futures curve in which later prices exceed nearby prices, often reflecting financing, storage and carry.
Exchange-eligible: Metal meeting exchange specifications but not currently registered by warrant for delivery.
Exchange-registered: Eligible metal for which an exchange warrant has been issued, making it available for delivery under exchange procedures.
Fabrication demand: Silver used to manufacture industrial products, jewelry, silverware, photographic materials or investment products.
Futures contract: A standardized agreement to buy or sell a quantity at a future date under exchange rules.
Gold-to-silver ratio: The gold price divided by the silver price using consistent units and timing.
Hedge: A position intended to reduce exposure to an adverse price move.
LBMA: London Bullion Market Association, which sets standards and owns precious-metal benchmark intellectual property.
Melt value: The gross market value of contained metal before deductions.
Mineral resource: A concentration with reasonable prospects for eventual economic extraction, not necessarily economically mineable today.
Mineral reserve: The economically mineable part of a measured or indicated resource after applying modifying factors.
Nominal price: Price in the currency units of that future date.
Numismatic value: Value arising from rarity, grade, history, provenance and collector demand.
Premium: Amount paid above a reference metal value.
Primary silver mine: A mine for which silver is the principal economic product.
Real price: Price adjusted for inflation to a stated base year.
Recycling supply: Silver recovered from scrap and returned to market, subject to provider definitions.
Refining charge: A fee for processing and recovering payable metal.
Retail spread: Difference between the customer’s buying price and selling price for a product.
Scrap silver: Silver-bearing material sold for recovery rather than continued use in its current form.
Spot price: A quotation for near-immediate wholesale metal; not a universal retail transaction price.
Structural deficit: A recurring estimated shortfall of annual supply relative to defined demand categories; it does not by itself prove settlement failure.
Troy ounce: Precious-metal unit equal to 31.1034768 grams.
Vaulted silver: Metal held in professional storage under allocated, pooled or unallocated arrangements.
Chart gallery#
The figures below are generated from the disclosed scenario and transaction tables. They are analytical illustrations, not observed future data.
Nominal annual-average scenario ranges#
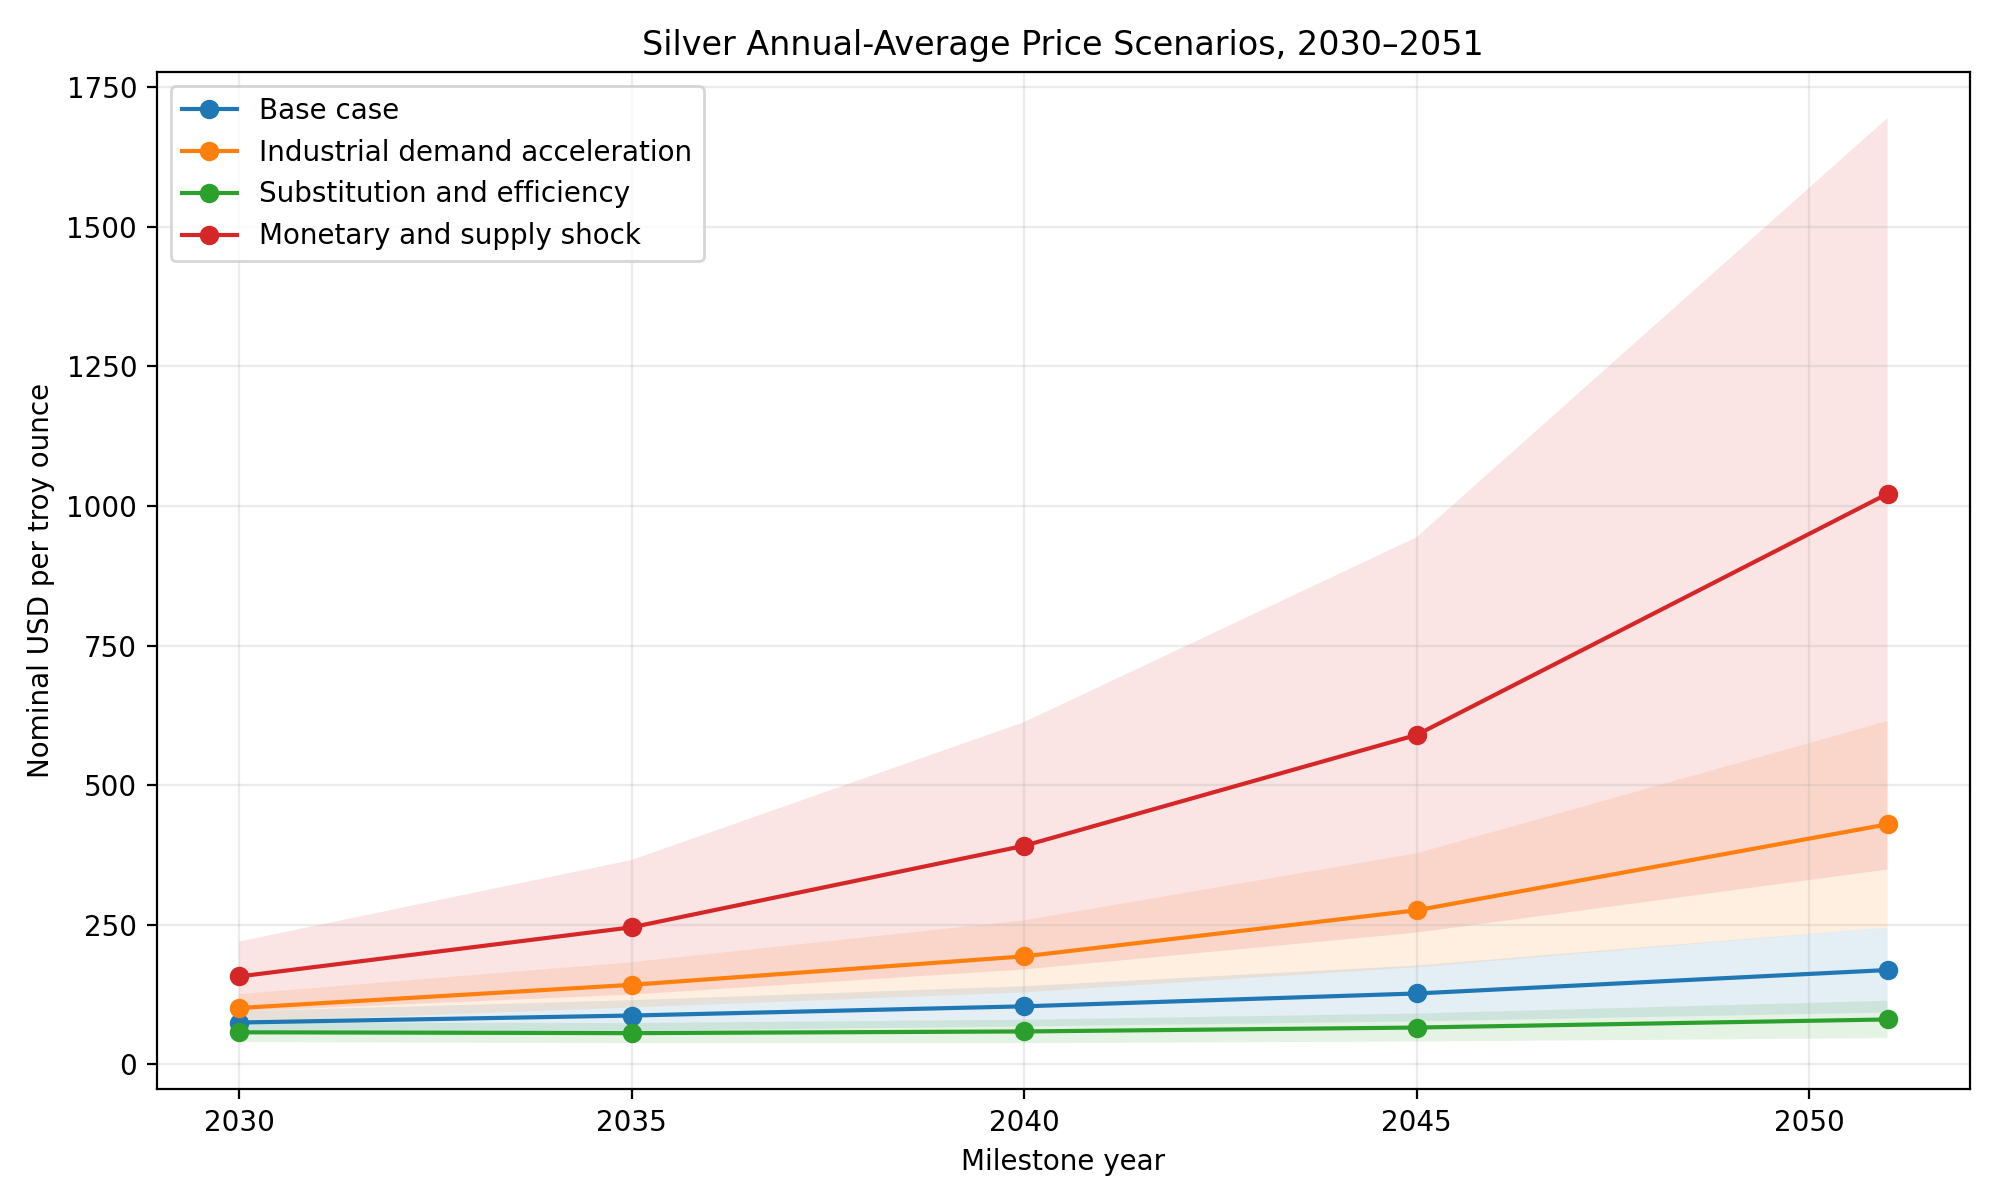
Real 2026-dollar scenario ranges#
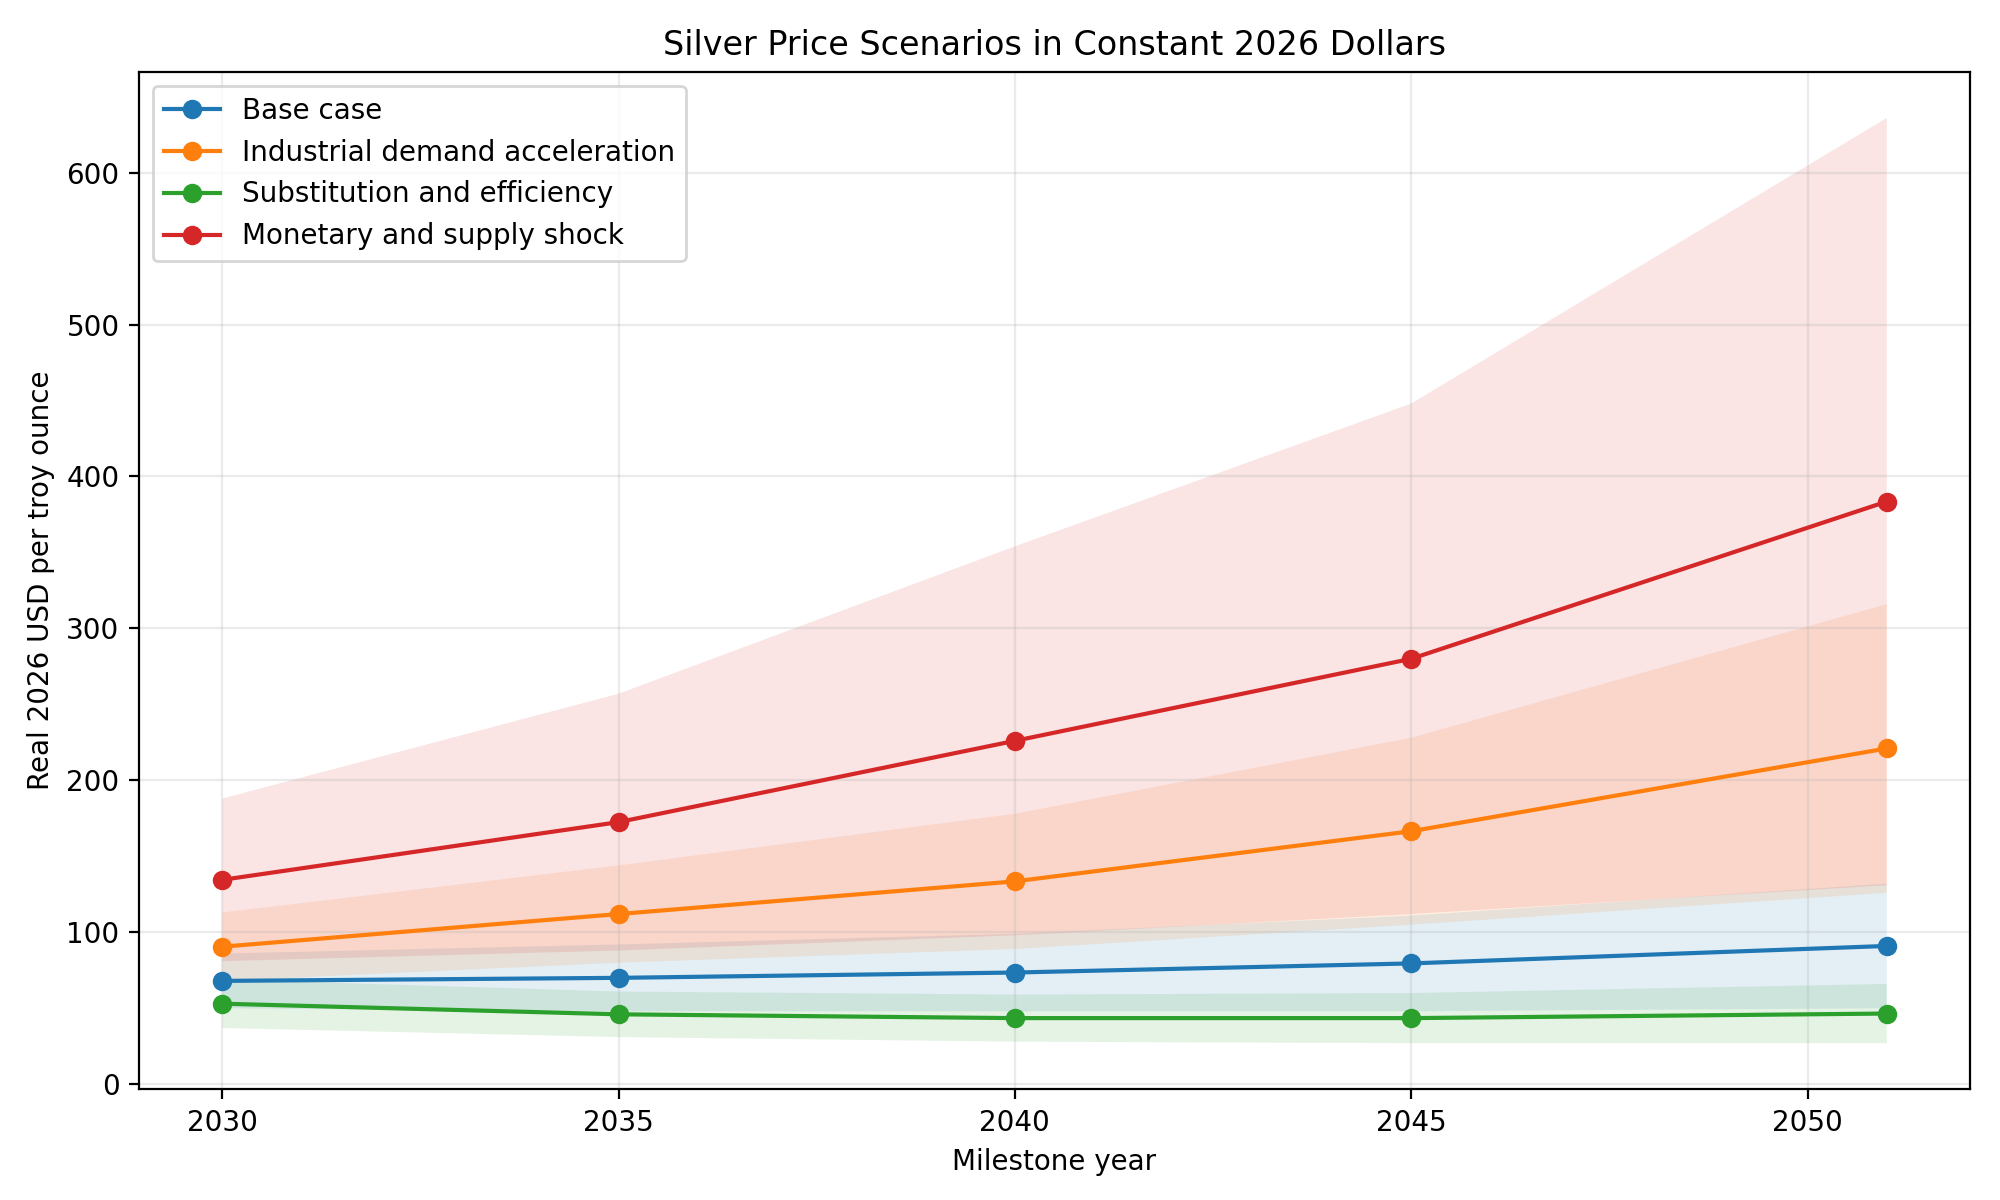
Base-case supply and demand#
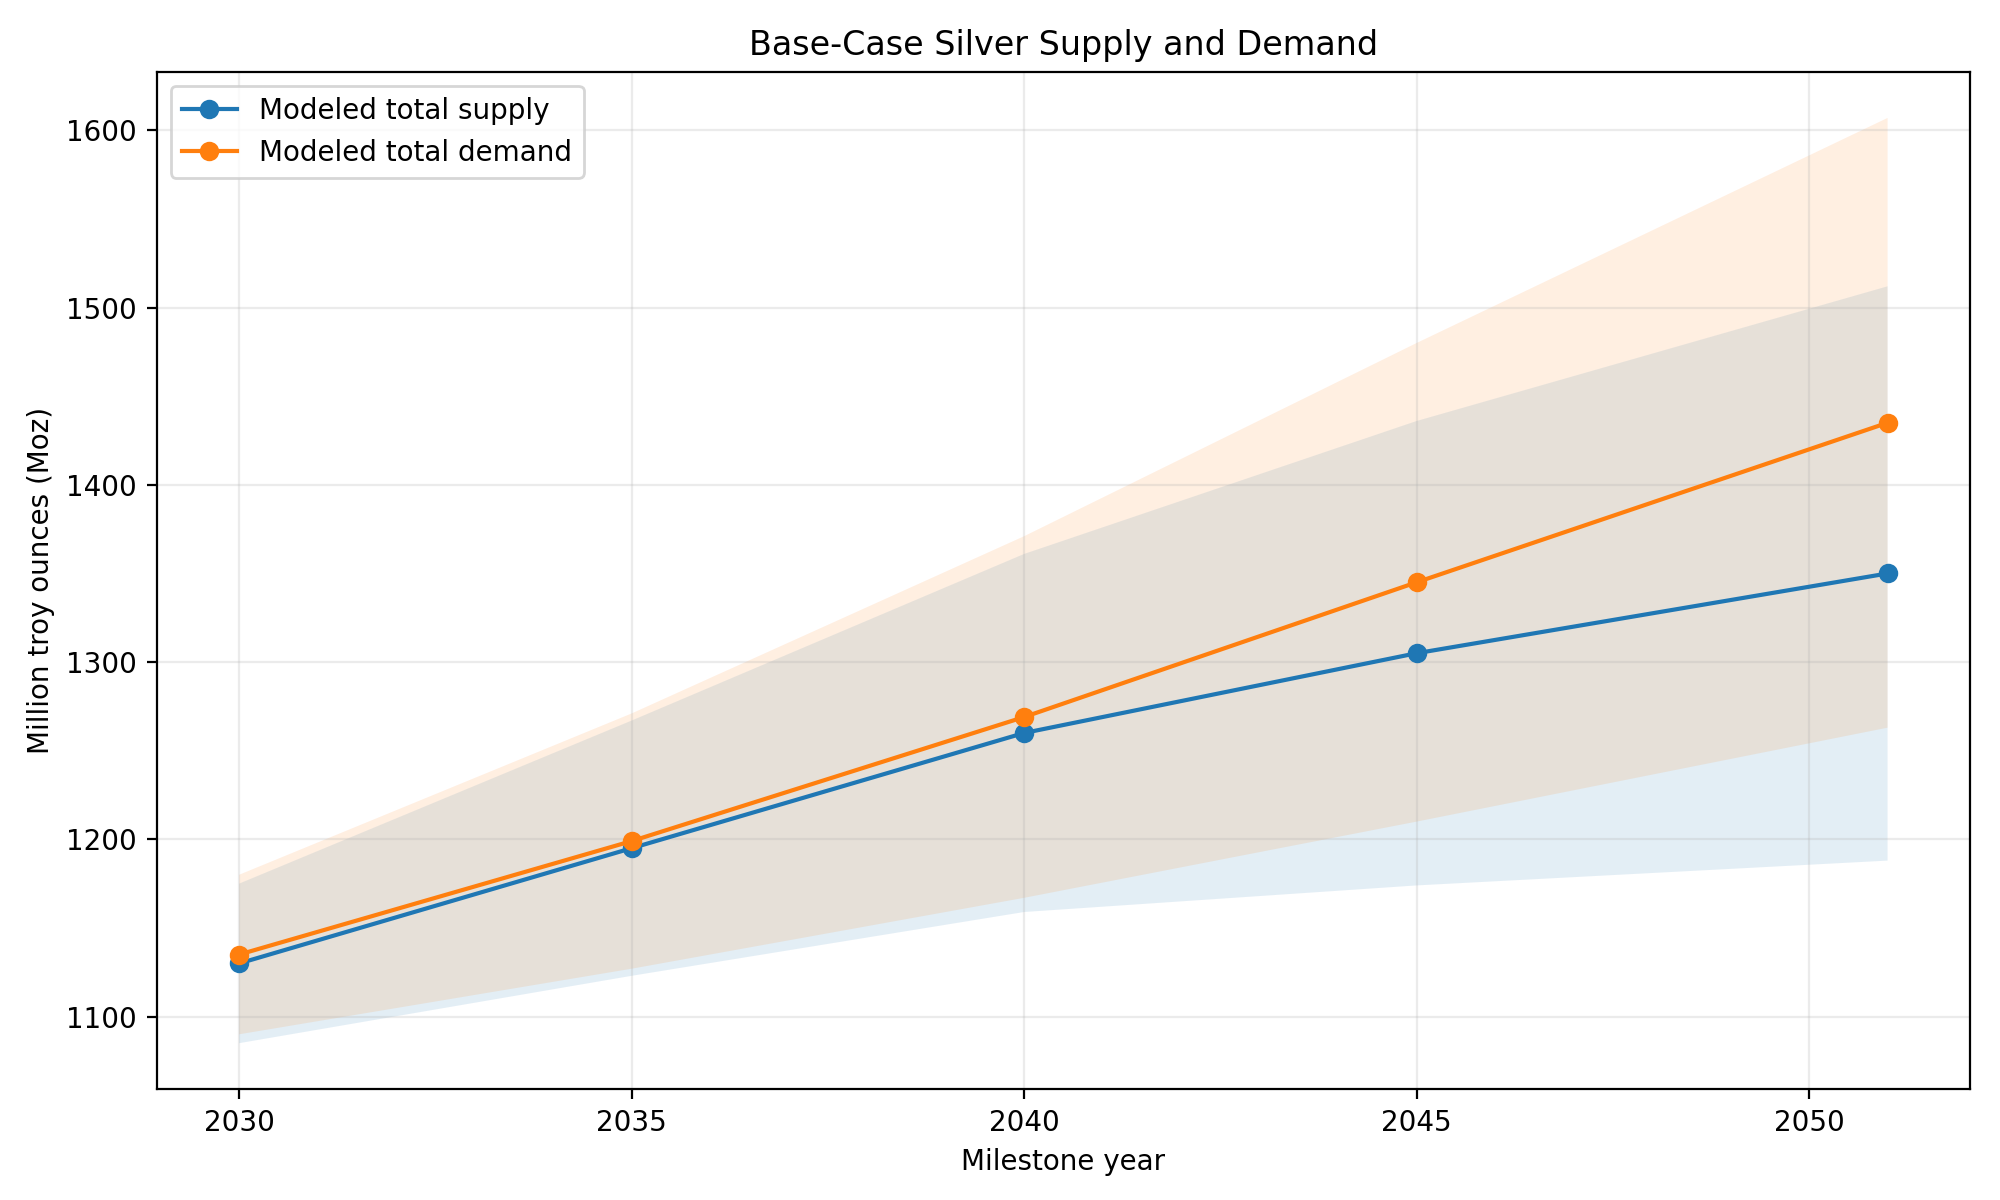
Photovoltaic silver-demand sensitivity#
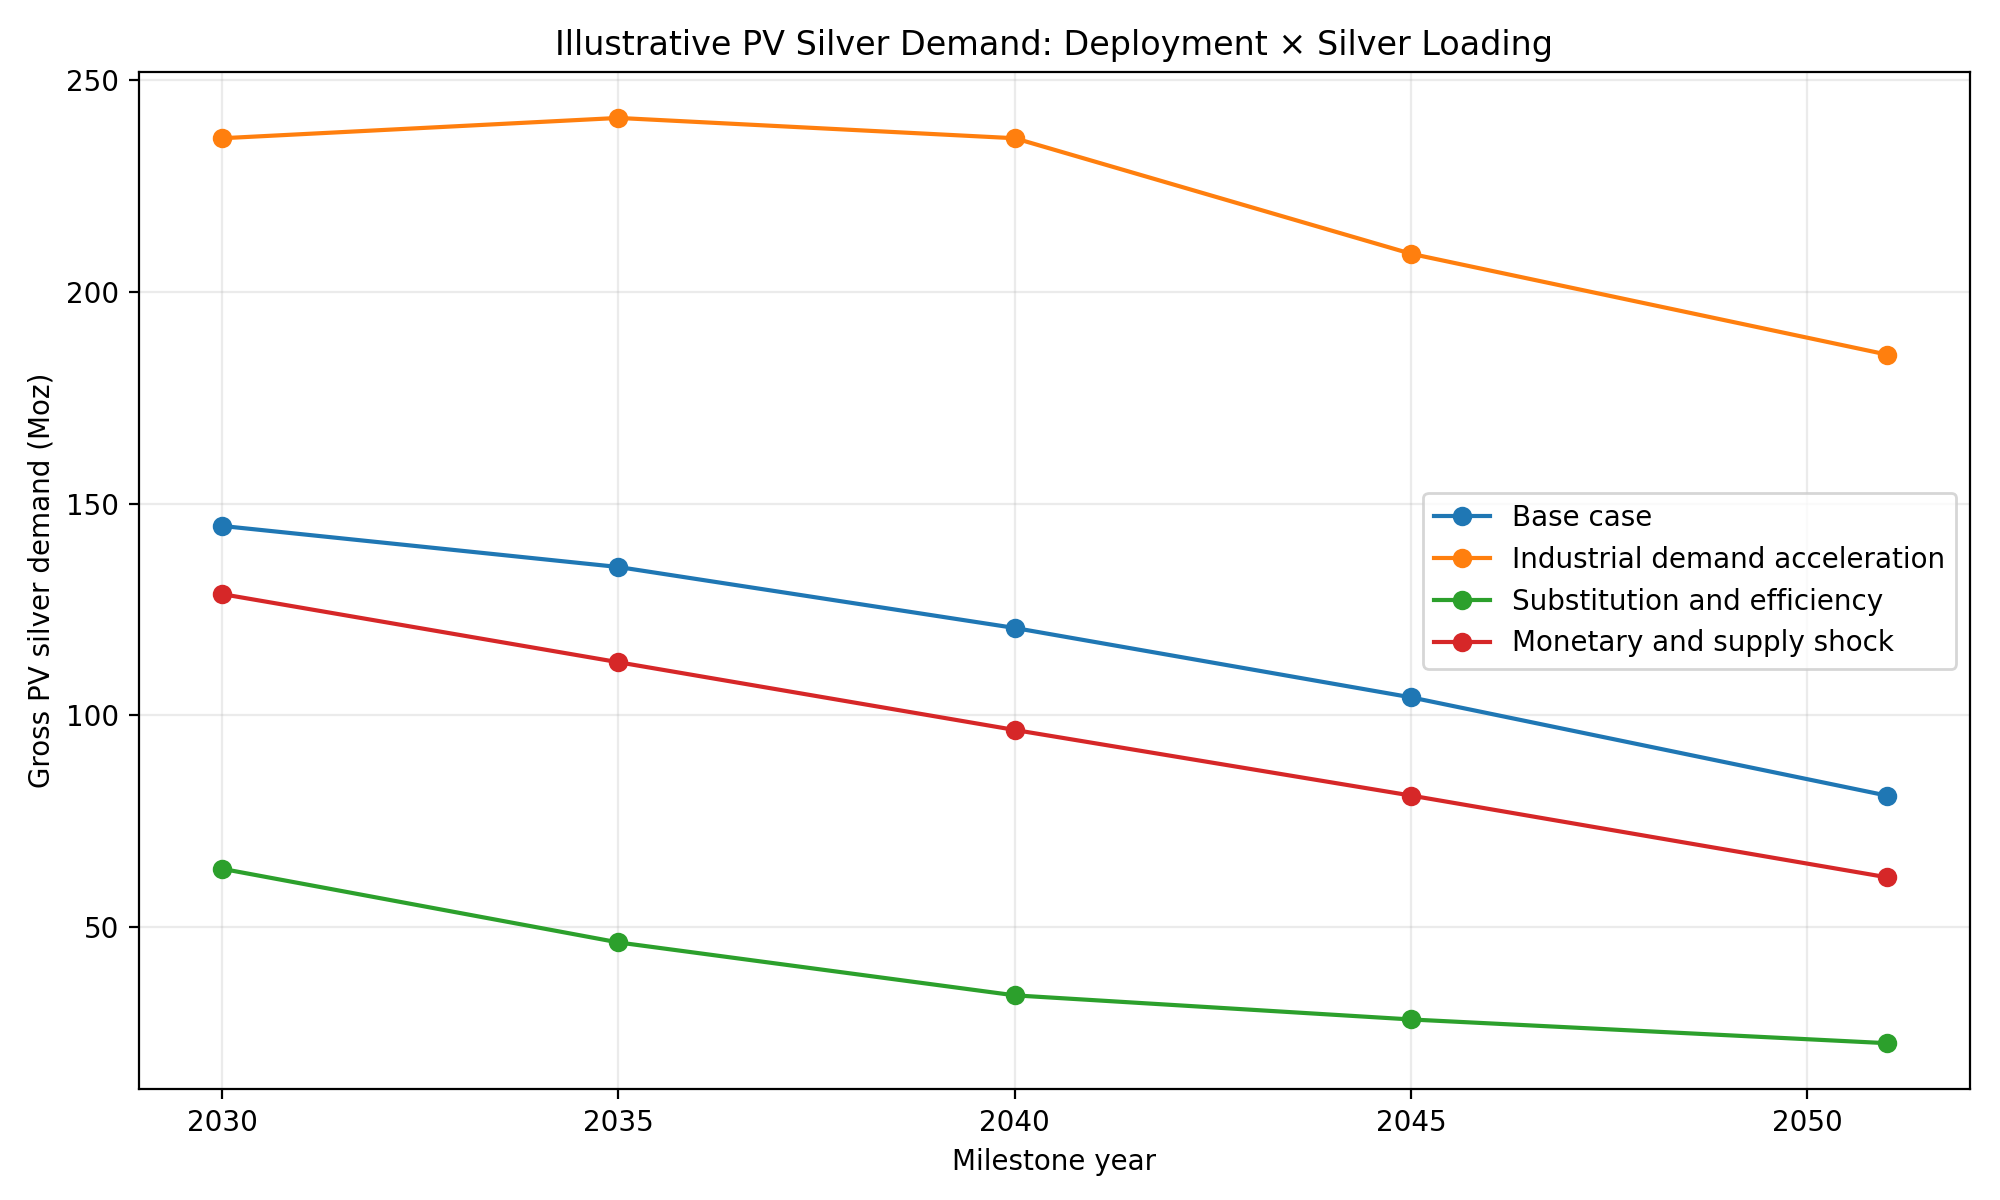
Retail transaction break-even#
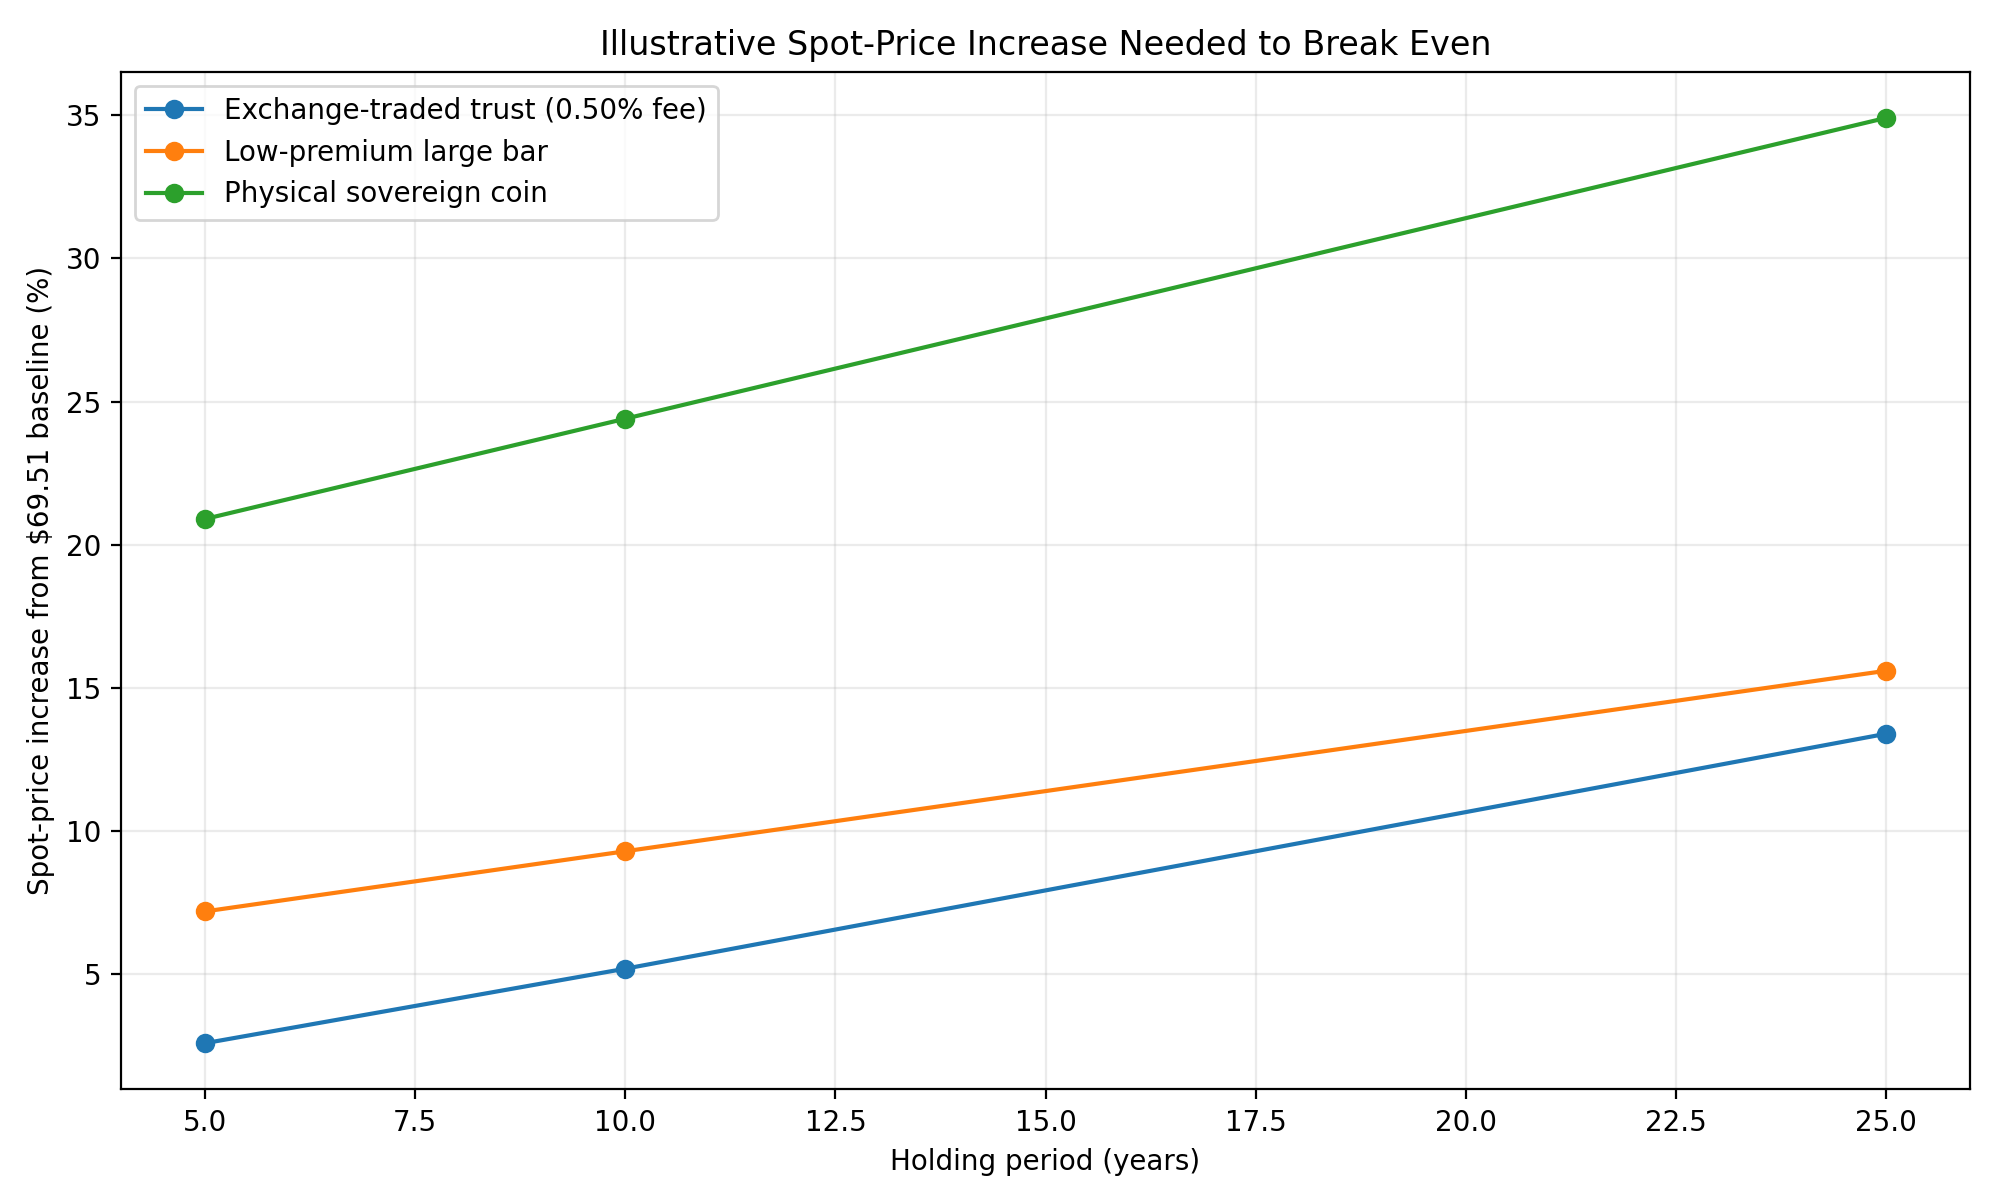
2026 baseline components#
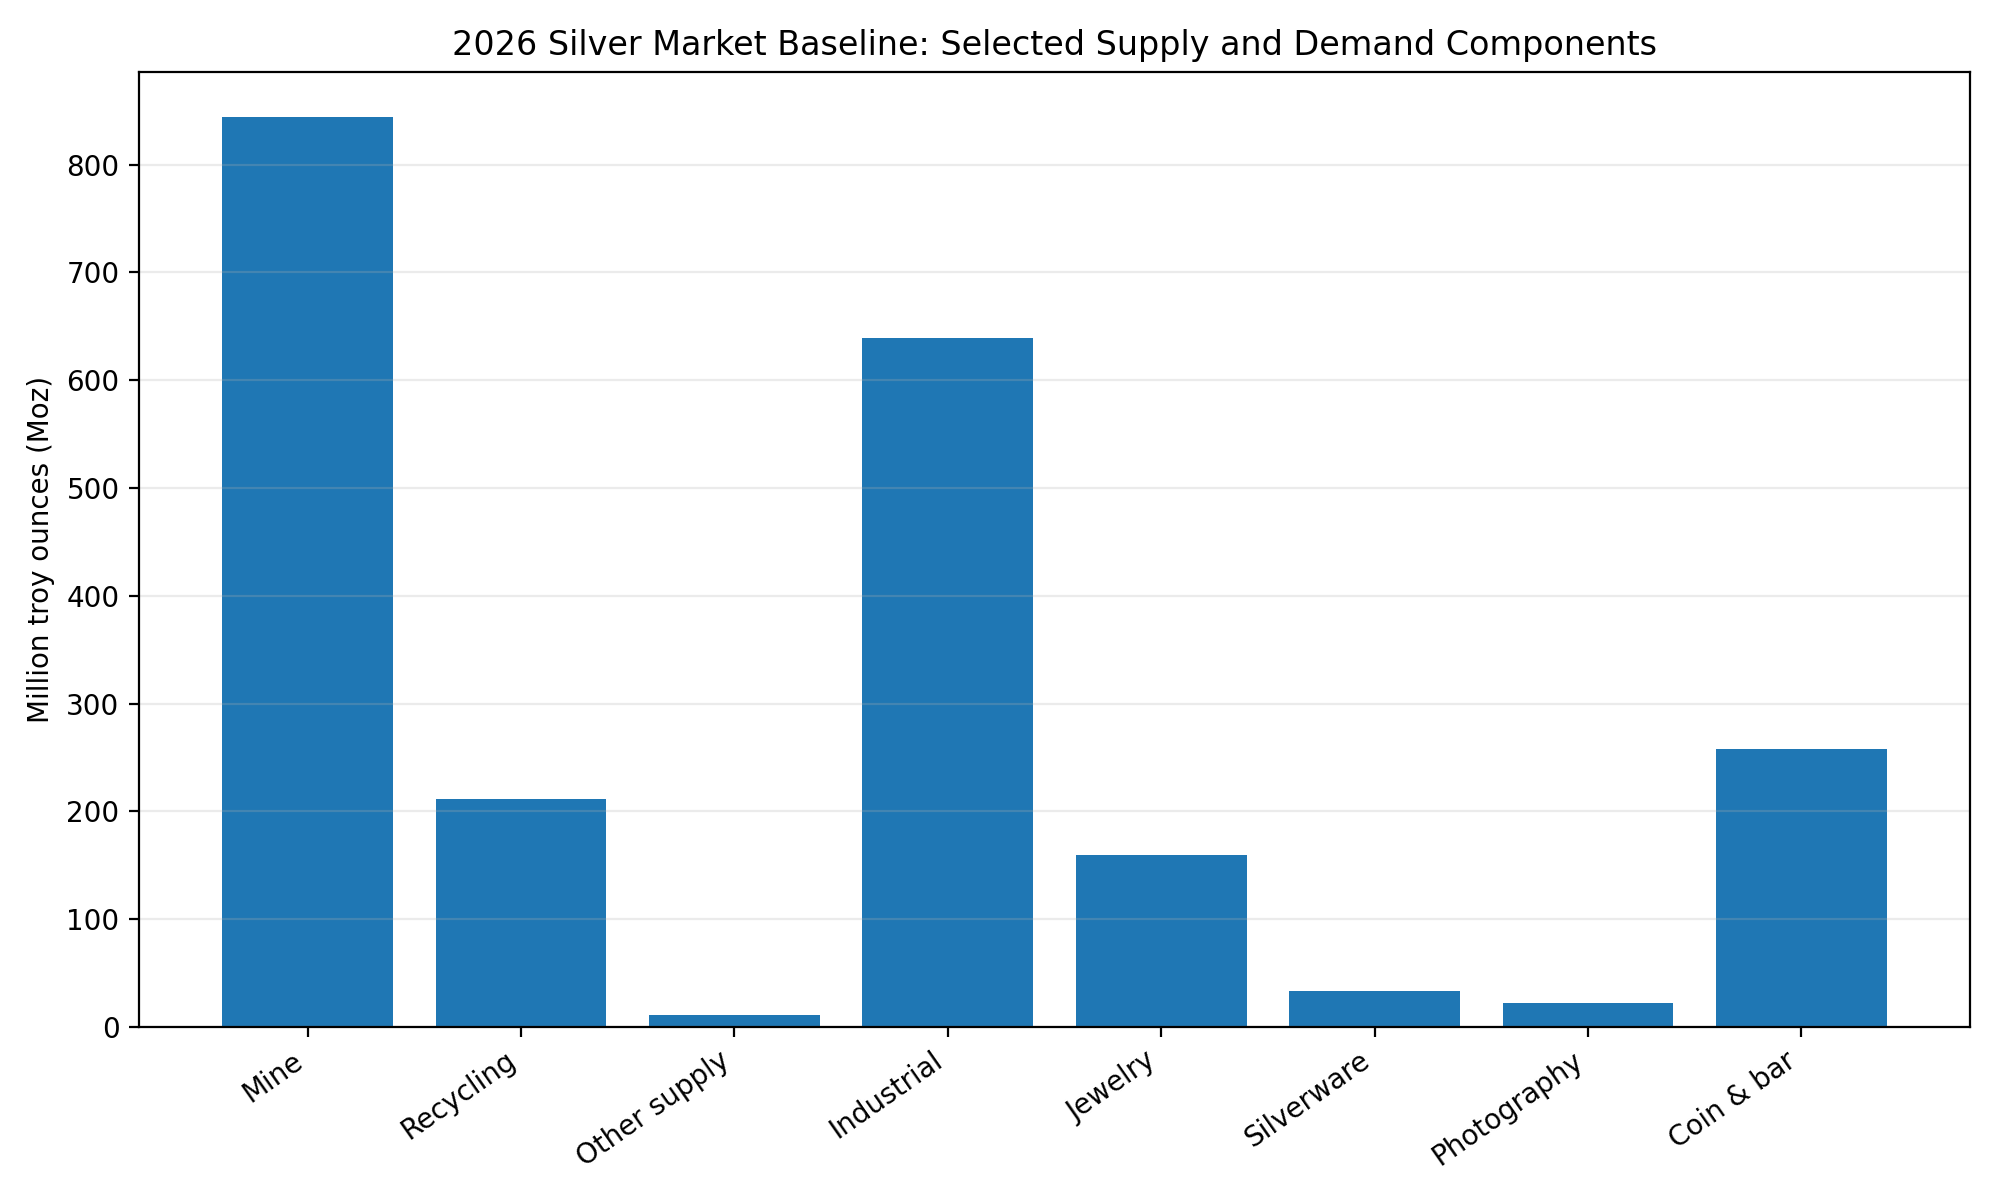
Observed facts versus scenario-dependent conclusions#
Observed or externally estimated at the forecast origin#
- The last completed pre-origin LBMA Silver Price was $69.510/oz.
- The 2026 industry balance forecast mine supply of 844.1 Moz, recycling of 211.3 Moz, total demand of 1,112.6 Moz and a 46.3 Moz deficit.
- London vaults held 28,213 tonnes at the end of July 2026.
- SLV reported 491.75 Moz in trust on August 21, 2026.
- U.S. CPI was 3.4% year over year in July, the federal funds target was 3.50%–3.75%, and the 10-year real Treasury yield was 2.40%.
- Solar additions exceeded 600 GW in 2025.
- Research and pilot processes had demonstrated silver consumption well below conventional industrial practice, including 1.4 mg/W SHJ and plated pathways near 1.1 mg/W.
- Documented precious-metals spoofing enforcement actions exist.
Scenario-dependent projections#
- All 2030–2051 price ranges.
- Mine, recycling and demand paths after 2026.
- PV loading and annual installations after published near-term forecasts.
- Dealer premium and buyback environments.
- Tokenization adoption and 2051 selling workflows.
- The degree of regulatory tightening.
- The probability and duration of monetary or supply shocks.
Methodology limitations#
This is a transparent scenario model, not a structural econometric forecast with stable coefficients.
The supply-demand baseline relies heavily on Metals Focus estimates commissioned by the Silver Institute. They are coherent and widely used but industry-funded and partly survey-based. USGS data provide an official cross-check on mine production and reserves but use different timing and classification. The two should not be expected to match exactly.
Long-range mine estimates are not a project-by-project reserve schedule. Beyond 2035, project identity becomes too uncertain. The model uses plausible aggregate paths informed by current projects, by-product dependence and development lags.
Solar deployment and loading assumptions are independent scenario inputs. Laboratory or pilot achievements may fail commercially; conventional processes may improve faster than assumed. The PV recycling rows are illustrative future secondary supply, not a lifecycle cohort model.
Price ranges are an ensemble judgment using real cost, balance, monetary regime, gold relationship, industrial demand and investment flows. They have not been assigned numerical probabilities because the evidence does not support precise odds. The shock upper range is deliberately broad and low-confidence.
Retail premium and buyback assumptions are illustrative because no complete audited global transaction dataset exists. Taxes are excluded from case studies and vary by jurisdiction.
The model does not claim that annual deficits accumulate into a proven missing stock. Inventory categories overlap, private holdings are unreported, and ETP flows can reverse. The model’s balance is a pressure indicator.
The best use of this paper is not to select one number. It is to monitor the variables that distinguish the scenarios and update the range when evidence changes.
Bibliography#
Bank for International Settlements (BIS). 2026. “Anchoring Trust in Money: Innovation beyond Stablecoins.” Annual Economic Report 2026, chap. 3. https://www.bis.org/publ/arpdf/ar2026e3.htm.
BlackRock. 2026. “iShares Silver Trust (SLV): Key Facts.” Data as of August 21, 2026. https://www.ishares.com/us/products/239855/ishares-silver-trust-fund.
Bureau of Labor Statistics (BLS). 2026. “Consumer Price Index Summary—July 2026.” https://www.bls.gov/news.release/cpi.nr0.htm.
Canada Revenue Agency (CRA). 2026. “Definition of ‘Financial Instrument’—Precious Metals.” https://www.canada.ca/en/revenue-agency/services/forms-publications/publications/17-1/definition-financial-instrument.html.
CME Group. 2026. “Silver Futures Settlements.” Accessed August 24, 2026. https://www.cmegroup.com/markets/metals/precious/silver.settlements.html.
Commodity Futures Trading Commission (CFTC). 2018. “CFTC Orders Deutsche Bank to Pay $30 Million Penalty for Manipulation, Attempted Manipulation, and Spoofing in the Precious Metals Futures Markets.” January 29. https://www.cftc.gov/PressRoom/PressReleases/7682-18.
———. 2020. “CFTC Orders JPMorgan to Pay Record $920 Million for Spoofing and Manipulation.” September 29. https://www.cftc.gov/PressRoom/PressReleases/8260-20.
Discovery Mining. 2026. “Cordero Project and Corporate Overview.” Accessed August 24, 2026. https://dsvmining.com/English/home/default.aspx.
Evident Scientific. 2026. “Detecting Counterfeit Jewelry with XRF.” Accessed August 24, 2026. https://ims.evidentscientific.com/en/insights/worth-its-weight-in-gold-detecting-counterfeit-jewelry-with-xrf.
Federal Reserve Board. 2026a. “Federal Reserve Issues FOMC Statement.” July 29. https://www.federalreserve.gov/newsevents/pressreleases/monetary20260729a.htm.
———. 2026b. “Foreign Exchange Rates—H.10.” August 17. https://www.federalreserve.gov/releases/h10/current/.
Eckert, Jonas, Sven Kluska, René Haberstroh, Christian Schmiga, Sebastian Mack, Mathias Kamp, Damian Brunner, Jan Nekarda, and Florian Clement. 2026. “Inline Plating of Ni/Cu Contacts for Industrial TOPCon Si Solar Cells—Status and Outlook.” IEEE Journal of Photovoltaics. https://doi.org/10.1109/JPHOTOV.2026.3663685.
———. 2025. “Silicon Heterojunction Solar Cells Realized with Record Savings in Silver.” https://www.ise.fraunhofer.de/en/press-media/news/2025/silicon-heterojunction-solar-cells-realized-with-record-savings-in-silver.html.
———. 2026. “Copper-Metallized Silicon Solar Cells.” Accessed August 24, 2026. https://www.ise.fraunhofer.de/en/business-areas/photovoltaics-materials-cells-and-modules/silicon-solar-cells-and-modules/copper-metallized-silicon-solar-cells.html.
ICE Benchmark Administration. 2026. “LBMA Gold and Silver Price.” Accessed August 24, 2026. https://www.ice.com/iba/lbma-precious-metals.
Inland Revenue Authority of Singapore (IRAS). 2026. “Supplies Exempt from GST—Investment Precious Metals.” Accessed August 24, 2026. https://www.iras.gov.sg/taxes/goods-services-tax-%28gst%29/charging-gst-%28output-tax%29/when-is-gst-not-charged/supplies-exempt-from-gst.
Internal Revenue Service (IRS). 2026. “Topic No. 409, Capital Gains and Losses.” Accessed August 24, 2026. https://www.irs.gov/taxtopics/tc409.
International Energy Agency (IEA). 2025. Renewables 2025. Paris: IEA. https://www.iea.org/reports/renewables-2025.
———. 2026a. Global Energy Review 2026. Paris: IEA. https://www.iea.org/reports/global-energy-review-2026.
———. 2026b. Global EV Outlook 2026. Paris: IEA. https://www.iea.org/reports/global-ev-outlook-2026.
———. 2026c. Electricity 2026: Grids. Paris: IEA. https://www.iea.org/reports/electricity-2026/grids.
London Bullion Market Association (LBMA). 2026a. “London Gold and Silver Vault Data for July 2026.” https://www.lbma.org.uk/newsroom.
———. 2026b. “LBMA Silver Price FAQs.” https://www.lbma.org.uk/prices-and-data/lbma-silver-price/lbma-silver-price-faq.
———. 2026c. “LBMA Precious Metal Prices.” https://www.lbma.org.uk/prices-and-data/lbma-precious-metal-prices.
MetalCharts. 2026. “COMEX Silver Price & Inventory—Registered and Eligible Stocks.” Data for August 21, 2026. https://metalcharts.org/comex/silver.
Metals Focus. 2026. World Silver Survey 2026. Prepared for the Silver Institute. London: Metals Focus. Release summary at https://silverinstitute.org/elevated-lease-rates-regional-liquidity-tightness-and-robust-investor-interest-resulted-in-record-silver-prices-in-2025/.
Pan American Silver. 2026a. “Pan American Announces Revised PEA for the La Colorada Skarn Project.” https://panamericansilver.com/news/pan-american-announces-revised-pea-for-the-la-colorada-skarn-project-positions-la-colorada-as-a-future-top-tier-silver-mine/.
———. 2026b. “Escobal” and “Second Quarter 2026 Financial Results.” https://panamericansilver.com/operations/silver-segment/escobal/.
Royal Mint. 2026. “Britannia Security Features and Benefits.” https://www.royalmint.com/us/invest/silver-stackers/britannia-security-features-and-benefits/.
Silver Institute and Oxford Economics. 2026. “Silver Demand Forecast to Expand Across Key Technology Sectors.” https://silverinstitute.org/silver-demand-forecast-to-expand-across-key-technology-sectors/.
U.S. Department of the Treasury. 2026. “Daily Treasury Real Yield Curve Rates.” Data for August 21, 2026. https://home.treasury.gov/resource-center/data-chart-center/interest-rates/TextView?field_tdr_date_value=2026&type=daily_treasury_real_yield_curve.
U.S. Geological Survey (USGS). 2026. “Silver Statistics and Information” and Mineral Commodity Summaries 2026. https://www.usgs.gov/centers/national-minerals-information-center/silver-statistics-and-information.
U.S. Mint. 2026. “West Point Mint Strikes New American Eagle Gold and Silver Coins.” https://www.usmint.gov/news/inside-the-mint/west-point-mint-strikes-new-american-eagle-gold-and-silver-coins.
U.S. Securities and Exchange Commission (SEC). 2026. “Statement on Tokenized Securities.” January 28. https://www.sec.gov/newsroom/speeches-statements/corp-fin-statement-tokenized-securities-012826-statement-tokenized-securities.
How to read this first edition#
The scenario tables and embedded figures are editorial illustrations built from stated assumptions. They are not current quotes, price targets, or a public model. Forecasts are uncertain, and the ranges should be read alongside the assumptions, limitations and cited historical baseline.
Conversion factors: 1 troy ounce = 31.1035 grams. 1 metric tonne = 32,150.7466 troy ounces. Dollar figures are U.S. dollars per troy ounce unless otherwise stated. Billion dollars are nominal U.S. dollars unless the table says otherwise.